Statshack – Aston Villa 2 Arsenal 4
Written by Dan on November 30, 2010
Apologies for the delay on this one, I haven’t had much chance to look at the data and ESPN have introduced significant changes to their match graphics which have made things difficult for me. They say a picture paints a thousand words, this will be graphically heavy I feel.
Firstly, the old cliché about a game of two halves couldn’t be more apt, could it? Villa were woeful during the first half. The opening gambit with Clark moving the ball to Bannan who shifted it to Warnock whose underhit pass was gobbled up by Arshavin to send Chamakh through for what should have been an opening goal inside a minute set the tone nicely.
Poor passing was the heart of our problems, but Arsenal must be given credit for the way they pressed from the front to the back, never giving Villa a moment to compose themselves. I took a look at the team heat maps at half time and Villa’s map was almost entirely contained within our own third and the middle third whilst Arsenal’s map covered the same area; their third of the pitch barely seeing any action from either team. Unusual and incredibly one-sided.
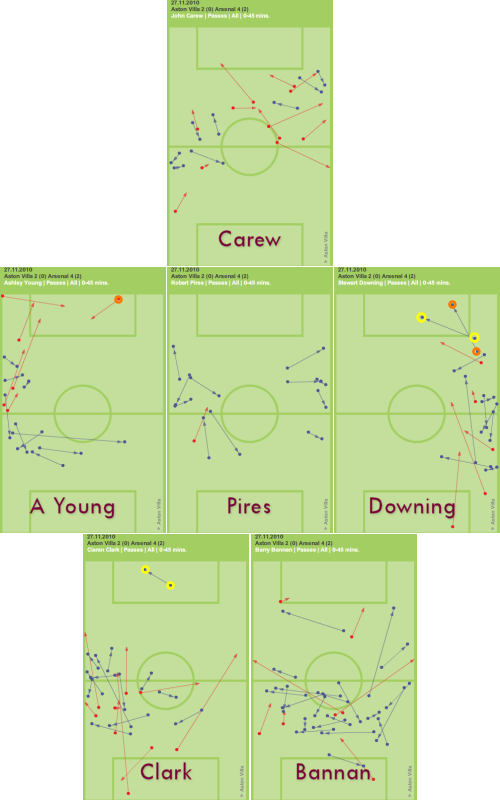
As an illustration of how little we were able to get forward, I’ve isolated the passing maps for our six attacking players and laid them out in the 2-3-1 of the 4-2-3-1 system we were using. You’ll notice that I’ve highlighted two passes on Stewart Downing’s map, one in yellow and one in orange, and marked the corresponding recipients on Ciaran Clark and Ashley Young’s maps.
The yellow is Downing’s 25th minute cross that was flicked on by Clark to Ash at the far stick, but his half-volley was over the bar. That was Villa’s best and only real chance of the first half. The orange highlight picks out Downing’s ball to Ashley Young, but his cut back came to nothing.
And that’s about as much as Villa created during the first half.

While Arsenal did a fantastic job of pressing from the front, Villa, well, didn’t. Carew, in his first game back from injury, didn’t exactly put himself about and 37 year old Robert Pires was never going to provide much of an obstacle, Song and Wilshire bypassing him with some ease. That pegged Clark and Bannan back so much they were practically on top of Collins and Dunne at times and it more closely resembled a disorganized back six than a back four. Asking for trouble.
And they didn’t take very good care of the ball when they did have it; John Carew in particular with a quite woeful 42% pass completion:-
| 1st Half Passing |
Good Passes | Bad Passes | % Complete |
| John Carew | 8 | 11 | 42% |
| Ashley Young | 9 | 6 | 60% |
| Robert Pires | 11 | 1 | 92% |
| Stewart Downing | 10 | 5 | 67% |
| Ciaran Clark | 13 | 9 | 59% |
| Barry Bannan | 21 | 7 | 75% |
| 72 | 39 | 65% |
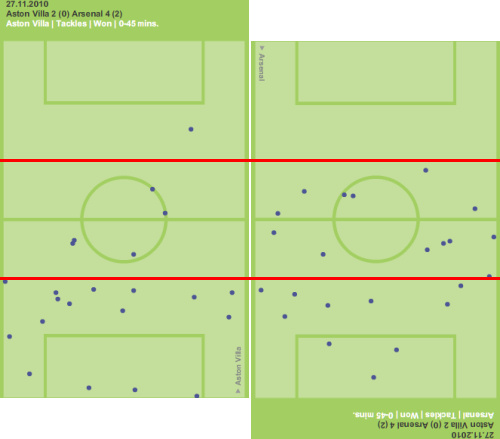
There were a number of unforced errors that contributed to some of the poor passing statistics above, but there were also a lot of forced errors. As I’ve already mentioned, Arsenal did an impressive job of defending from the front, the tackle map below illustrates this well. Sadly, it’s also an illustration of the territorial advantage Arsenal enjoyed during the first half.
I’ve focused on just the tackles that were won, shown with blue dots, and rotated Arsenal’s map through 180 degrees so the direction of play for each team is in opposing directions. This gives an accurate reflection of where the action took place. Talk about not being able to get out of your own half!

Aston Villa on the left, Arsenal on the right.
‘Tackles’ are split into three categories; ‘Aerial’, ‘Ground’ and ‘Take Ons’, and I wanted to break those down for the game to focus on the Takes Ons. Not only was the passing poor from Villa, frequently under pressure from Arsenal, but there was very little ability to beat a man.
| Tackles | Aston Villa | Arsenal | ||
| Won | Lost | Won | Lost | |
| First Half | ||||
| Aerial | 8 | 6 | 6 | 8 |
| Ground | 14 | 3 | 8 | 2 |
| Take On | 0 | 8 | 9 | 9 |
| Second Half | ||||
| Aerial | 17 | 14 | 14 | 17 |
| Ground | 11 | 3 | 13 | 1 |
| Take On | 4 | 10 | 12 | 4 |
| 54 | 44 | 62 | 41 | |
Average Position Maps
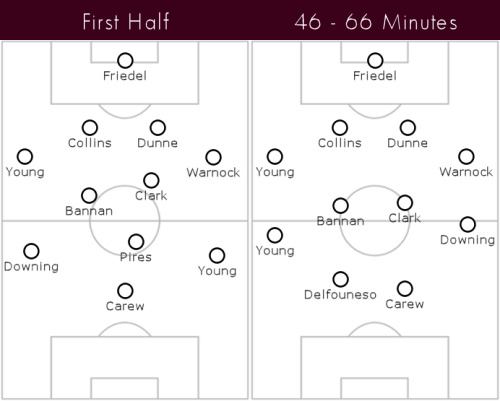
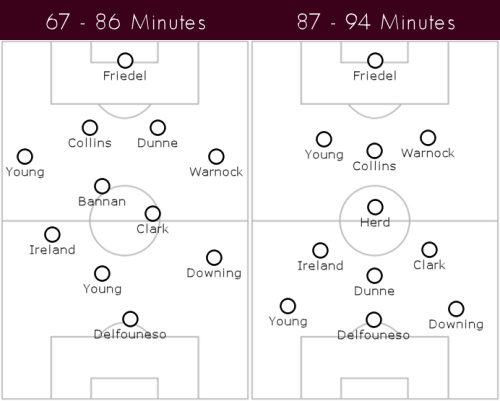
Things opened up considerably during the second half, I think some of the pressure may have been lifted from the shoulders of the Villa players, perhaps encouraged to be more positive, to move the ball more quickly, and they had nothing to lose. There were also several changes in the system and because of that there’s very little value in showing the average position map; it really is a mess.
Instead, I’ve broken down my own interpretation of the approach during several key phases including a slightly tongue in cheek representation of the hail mary tactics during the closing minutes.
In terms of summarising where this game was won and lost, it all happened in the first half where Arsenal played us off the park, clearly determined to make up for the major disappointments in their previous two games.
As for Houllier’s tactics and team selection, were there mistakes? Clearly yes. Pires, at 37, probably shouldn’t be starting games, and certainly not at this stage of what will be a short Villa career and not against Arsenal of all teams.
That said, combating Arsenal’s attacking 4-3-3 system is difficult with a full squad to select from, but for us at the moment it’s almost a Hobson’s choice at every position. If not Pires, then, Houllier could only have looked to Stephen Ireland and, although he did look better during the time he was on the pitch, I’m not convinced he would have offered any more than Pires did had he started.
Eyebrows might be raised at seeing Barry Bannan playing so deep as one half of the double pivot, rightly so too (although the intention may have been to use his passing ability to distribute from the back), but the only real alternative would have been to play Clark as a loan defensive midfielder in a 4-1-4-1 system. Given how that would not have allowed him to roam forward so much and the fact that he was the scorer of both goals and probably should have had a hat-trick, it’s extremely questionable whether that would have yielded a better result.
Perhaps Delfouneso should have started instead of Carew. Maybe he should have played as well as Carew, thereby solving the Pires/Ireland question, something we’ll never know for sure, but it certainly seemed better that way after the break, although the game was at 0-2; a major factor.
As for the debate about the wingers, well during the first half it’s largely irrelevant since Villa enjoyed so little possession with next to no penetration in the final third. If anyone can build a convincing argument that the root cause of Arsenal’s domination was down to Villa’s inverted wingers I’d be delighted to look at it, but I really don’t see how it made any difference myself. Not from a defensive perspective.
It remains a fact that Villa’s only real goal chance during the first half was Downing’s right sided centre to Ash at the far post on the left hand side. Other than that, from an attacking perspective, without being able to get out of their own half, what difference did it make?
I’m running out of time and space here, but hopefully I’ll get chance to put together a comparison between this performance against Arsenal and the one against Man Utd recently. It’s interesting that the possession was the same in both game; 40/60, and as poor as Villa’s pass completion was in this one (70%), it was worse against Utd (68%). The difference is even more pronounced focusing just on passes in open play; 71% vs Arsenal, but just 61% against Utd.
Villa completed more than twice as many passes against Arsenal as they did against Man Utd and had a larger share of all the passes in the game, but generated far lass scoring chances and yet still scored the same number of goals.
The devil, as ever, is in the detail, but it’s interesting to gauge the different reactions to the two games given the underlying similarities. Ultimately, I suppose, despite deriving pleasure from seeing more attractive football (although beauty always lies in the eye of the beholder) and perhaps at least feeling a warm glow about seeing academy players given a chance (even though the injury crisis means there is no other choice) football remains a results driven business.
| 2 | Aston Villa | November 28th 2010 | Arsenal | 4 |
| 40% | Possession % | 60% | ||
| 7 | Shots | 20 | ||
| 4 | On Target | 7 | ||
| 3 | Corners | 8 | ||
| 3 | Offsides | 3 | ||
| Clark 52′, 71” | Scorers | Arshavin 39′, Nasri 45′, Chamakh 56′, Wilshire 90′ | ||
| Clark | Booked | Chamakh | ||
| Sent Off | ||||
| 329 | Good Passes | 528 | ||
| 38% | CPS % | 62% | ||
| 138 | Bad Passes | 122 | ||
| 70% | Completion % | 81% | ||
| 25 | Interceptions | 27 | ||
| 54 | Tackles Won | 62 | ||
| 44 | Tackles Lost | 41 | ||
| 55% | Success % | 60% | ||
| 4 | Blocks | 1 | ||
| 10 | Free Kicks | 13 | ||
| Formations Used | ||||

|
||||

|
||||
You can find Statshacks from other games here.
[Original data and graphics courtesy of ESPN and The Guardian]