Statshack – Tottenham 2 Aston Villa 1
Written by Dan on October 3, 2010
Instead of any tactical analysis in this Statshack, I thought I’d share something I was looking at ahead of this game: our record at White Hart Lane over the last few seasons.
The table below shows both teams’ complete and incomplete passing numbers which, of course, is the basis for “Completed Pass Share”. I’ve also included the possession figures and then further combined the two percentages to form what I’m calling “Game Share”. What I’m trying to achieve is a simple metric that gives you a flavour of who have the greater ownership of the ball.
Our record over the last five games at WHL now suggests that we really ought to be focused on playing counter attacking football there. We’ve lost two, drawn two and won one, but curiously, our “Game Share” was greatest in the two games we lost – 46% in 2006/07 and 48% in 2010/11.
We had our slimmest grip on the game in 2007/08, the 4-4 draw we probably all think we would have won if not for the penalty Harewood conceded, but we only really owned 31% of the game. We won in 2008/09 with a 37% share of the game and ground out a 0-0 draw last season with 44% of the game.
We completed the most number of passes yesterday by a mile and ran Tottenham close for possession, but the historical statistics suggest we should have sat deeper, inviting Spurs onto us before hitting them on the break.
That’s if we were primarily concerned with the result, Houllier may have been pleased that the team are gradually beginning to play the way he wants and feels confident that the results will come in time.
As I said in the first review post, the overall performance wasn’t horrible, although there were one of two questionable shifts put in. There’s plenty of work to be done, obviously, but aside from the result, looking at yesterday’s game in comparison with the previous four matches at Tottenham’s place, we can’t be too down, surely?
For me, it’s a little tricky, I frequently dismissed most of MON’s perceived shortcomings because he got the results and I’ve been very clear that’s what is more important to me. I’d hate to appear to be making a U-turn now by implying that the performance or quality of entertainment trumps the result, but I’m definitely encouraged by the potential I see.
Average Position Maps
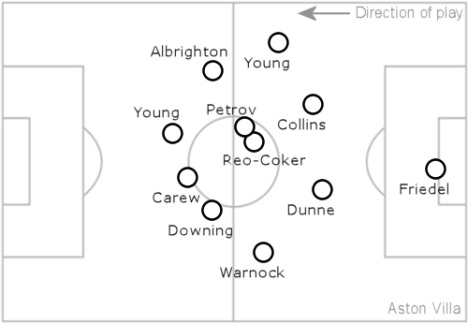
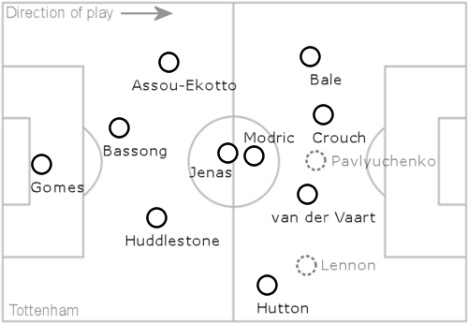
I’ve tweaked the average position maps a little to include the player names for both teams now, so it should be easier to read at a glance. The relative compactness of Villa is noteworthy to say the least.
It’s generally my policy to only show eleven players, usually the starting eleven, but the real aim is to show the eleven who played the longest period together. As Heskey went off after 35 minutes, I’ve shown John Carew instead.
Tottenham’s map is the exception to the rule since Redknapp swapped Pavlyuchenko for Lennon at half time, so both are shown, but with dotted lines to indicate neither played a full game.
Actually, just to break the promise about no tactical talk in this post: it’s worth noting that Tottenham are still trying to work out where to accommodate van der Vaart since Redknapp is generally a 4-4-2 meat and potatoes man. Without a natural right-sider from the opening whistle, that was really supposed to be VdV’s brief, but as we know, he constantly drifted into the middle.
Sacrificing a striker for a winger allowed van der Vaart to play in the middle without inhibition and he actually dropped deeper in the second half, timing runs into the box that we were never able to get a grip on. Although the first goal was coming, Redknapp must have made his mind up to make the switch before it came and stuck to his guns despite going into the break on terms.
That was the right move and we didn’t really respond until we’d gone behind and it was too late.
Other Stats Of Note
I was surprised by the number of offsides considering Tottenham’s makeshift partnership at centre half and the relative positioning of the back lines make that statistic even more baffling. The four offenders were Ash (twice), Downing (twice), Heskey and Warnock.
Actually, I say ‘offenders’, but they were the ones flagged off, I’d have to review the incidents to see whether the passer or runner was at fault, but it remains a frustrating statistic, who knows how many of those could have lead to a good opportunity with a bit more care to avoid straying offside?
The number of blocks and interceptions Villa made in comparison to Spurs is also extremely noteworthy. Once again, although our ownership share of the ball was much larger than in previous visits to White Hart Lane, and that is something to be encouraged by, it’s clear which side was being the more productive with their share.
The less than 50% tackle success rate is again predominantly down to losing aerial duals. Before you leap to the conclusion that it was all Peter Crouch’s doing, he actually took part in seven of these aerial duals and won four. Three of them were in the box and two fell to van der Vaart who scored both times.
As the kids are fond of saying these days, simples.
| 2 | Tottenham | October 2nd 2010 | Aston Villa | 1 | ||||||||||||||||||||
| 53% | Possession % | 47% | ||||||||||||||||||||||
| 27 | Shots | 13 | ||||||||||||||||||||||
| 4 | On Target | 3 | ||||||||||||||||||||||
| 10 | Corners | 4 | ||||||||||||||||||||||
| 2 | Offsides | 6 | ||||||||||||||||||||||
| 45′, 75′ van der Vaart | Scorers | 16′ Albrighton | ||||||||||||||||||||||
| Bale | Booked | A Young, Albrighton, Collins | ||||||||||||||||||||||
| Sent Off | ||||||||||||||||||||||||
| 275 | Good Passes | 260 | ||||||||||||||||||||||
| 51% | CPS % | 49% | ||||||||||||||||||||||
| 74 | Bad Passes | 59 | ||||||||||||||||||||||
| 79% | Completion % | 82% | ||||||||||||||||||||||
| 10 | Interceptions | 34 | ||||||||||||||||||||||
| 32 | Tackles Won | 26 | ||||||||||||||||||||||
| 19 | Tackles Lost | 28 | ||||||||||||||||||||||
| 63% | Success % | 48% | ||||||||||||||||||||||
| 1 | Blocks | 12 | ||||||||||||||||||||||
| 25 | Free Kicks | 14 | ||||||||||||||||||||||
|
||||||||||||||||||||||||
| Average Position Maps | ||||||||||||||||||||||||
 |
||||||||||||||||||||||||
 |
||||||||||||||||||||||||
You can find Statshacks from other games here.
[Original data and graphics courtesy of ESPN and The Guardian]
