Statshack – Aston Villa 1 Bolton 1 – What We Have Here Is A Failure To Penetrate
Written by Dan on September 18, 2010

I’ve talked about this many, many times: possession football is all well and good, but if you don’t move the ball into position to score goals often enough, you don’t win many games. Our home record was 13th best in the league last season as we consistently struggled to roll inferior opposition over and that was to be the key challenge to address this season.
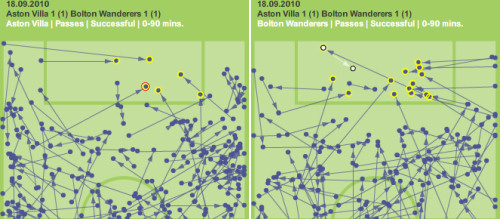
If Gérard Houllier learned anything from his position in the stands, it’s that grinding out wins against stubborn opponents playing on the counter remains an outstanding issue. Villa owned 57% of possession and had a 61% of the completed passes, but the graphic below, showing the completed passes in the opponent’s half for Villa on the left and Bolton on the right, illustrates the need to be direct at times.

I’ve highlighted the passes from outside the box to a team mate inside the box. I’ll save you the trouble of counting, Villa made six such passes, Bolton made 14, although six did come directly from throw-ins on the right hand side. This isn’t exclusively the reason why we win or lose, but it’s indicative of a complete lack of penetration from the home team and the reverse of what the situation should have been.
Two shots on target all game including Ash’s goal (Albrighton’s early effort from the right was classified as an incomplete cross) speaks for itself. If the ball can’t be worked into a goal scoring opportunity from open play, we should at least be winning throw-ins and corners, and we do, but we’ve become incredibly wasteful with dead ball situations. Eight corners today, just one landing on the head of a Villa player (James Collins).
The main theme of the Stoke Statshack was about missing Carew’s aerial threat and presence as a general focal point. That was case again today (no great shock, Stoke & Bolton aren’t dissimilar sides), but to a lesser extent. Still, just one 50/50 header won in the box all game – I’ve highlighted it with the red ring above – Carew’s nod down to Gabby which he probably should have finished.
That’s frequently the case with football, one single chance can separate teams, one situation where you press your advantage to manufacture an opportunity. You might think that shouldn’t be the case when we’re talking about Bolton here, and you could well be correct, but it was and it was spurned.
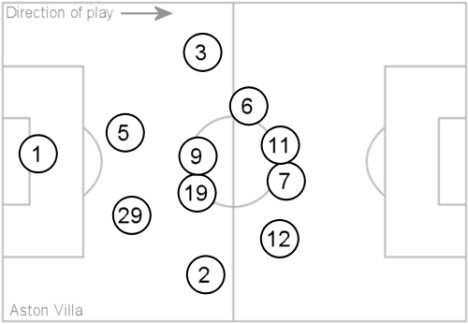
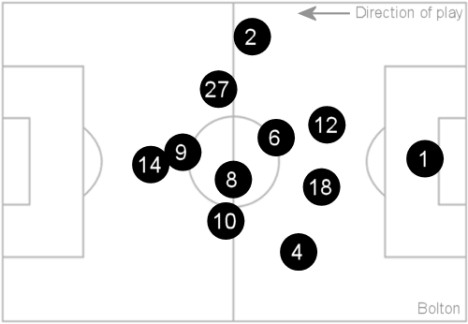
Average Position Map
Carlos Cuellar replaced Richard Dunne for the second half, but I’ve only shown Dunne (5) on the map. Cuellar’s position was marginally more advanced, but they were close enough that there was no value in showing both.
Andy O’Brien only played 18 minutes for Bolton and such was Villa’s dominance during the period he played, his average position would have been obscured on the map by Adam Bogdan, the goalkeeper. I normally prefer to only plot 11 players, so naturally I’ve shown Samuel Ricketts (18) instead.
| 1 | Aston Villa | September 18th 2010 | Bolton | 1 | ||||||||||||||||||||
| 57% | Possession % | 43% | ||||||||||||||||||||||
| 17 | Shots | 14 | ||||||||||||||||||||||
| 2 | On Target | 5 | ||||||||||||||||||||||
| 8 | Corners | 4 | ||||||||||||||||||||||
| 3 | Offsides | 1 | ||||||||||||||||||||||
| 13′ A Young | Scorers | 35′ K Davies | ||||||||||||||||||||||
| Warnock | Booked | Knight, K Davies | ||||||||||||||||||||||
| Sent Off | ||||||||||||||||||||||||
| 253 | Good Passes | 164 | ||||||||||||||||||||||
| 61% | CPS % | 39% | ||||||||||||||||||||||
| 63 | Bad Passes | 64 | ||||||||||||||||||||||
| 80% | Completion % | 72% | ||||||||||||||||||||||
| 17 | Interceptions | 10 | ||||||||||||||||||||||
| 36 | Tackles Won | 37 | ||||||||||||||||||||||
| 41 | Tackles Lost | 33 | ||||||||||||||||||||||
| 47% | Success % | 53% | ||||||||||||||||||||||
| 3 | Blocks | 7 | ||||||||||||||||||||||
| 7 | Free Kicks | 19 | ||||||||||||||||||||||
|
||||||||||||||||||||||||
| Average Position Maps | ||||||||||||||||||||||||
 |
||||||||||||||||||||||||
 |
||||||||||||||||||||||||
You can find Statshacks from other games here.
[Original data and graphics courtesy of ESPN and The Guardian]