Statshack – Wigan 1 Aston Villa 2
Written by Dan on March 17, 2010
I sometimes struggle to enjoy a game now and again, even ones we win, because the nervous energy doesn’t allow me to relax and be entertained. Maybe you’re the same. Maybe it’s just me. Either way, this wasn’t one of those games, I enjoyed almost every minute, even the final few. OK, maybe not the final few so much and probably not the opening 5 or so minutes, but in between it was really entertaining. I bet there’s a few Chelsea fans who wished they’d watched this game instead.
Fluidity
Wigan have had some horror shows this season, the worst of which occurred at White Hart Lane, but also some decent results. I’d like to think they count the 2-0 win at Villa Park as a scalp claimed along with the recent victory over Liverpool for instance. They can play some football, but like a lot of smaller sides that try to play an expansive, fluid style of football they’ll get beaten a fair amount. Hopefully they stay up, but they wouldn’t be the first team to get relegated that play attractive football at times.
Looking over the key statistics, you can see that Wigan edged the possession and passing, with an impressive pass completion rate. Based on those numbers you might blind pick them as the home side, but not the winner. We were worthy winners because we made the better use of the ball when we had it and that’s not an unfair summary of how we play. You should know that by now.
Shots
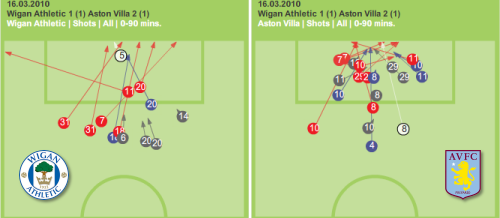
Here’s a great graphic that illustrates exactly why our defence can be so stingy. Wigan had a good number of shots (13) and they may have only managed 3 on target, but you can see on the left where they were restricted to shooting from in comparison to Villa on the right.
Incidentally, I neglected to mention Steve Sidwell’s late pile driver that might have added a third goal in the death and you can see it clearly in this graphic as the longest of all our shots. That would have been quite the tasty goal. You’ll also notice Milner’s goal, indicated by the white circle, isn’t much closer and that definitely was a tasty goal!

You really should go take a quick look at the average position map from the Stoke game featuring the more pedestrian front pairing of Carew and Heskey before checking out what Gabby’s pace does for us below. Seriously, go do it! It would be fair to describe Stoke and Wigan as different types of teams, but their quality levels are comparable and I think this shows that we absolutely need Gabby up front to open the rest of the side up behind him.
Gabby came on briefly against Stoke and although he wasn’t fully fit and didn’t have long enough to make much of an impact, you could see right away how his pace stretched the back line and pulled the whole side up the pitch to exploit the extra room. This is a great example of what a striker can do for the side even when he’s not scoring. With Emile Heskey, well, let’s just say it’s more nuanced.
Gabby had three shots in this game (1 on target, 1 off target and 1 blocked) which is usually enough for him to get on the score sheet, but even if he doesn’t add to his tally for the rest of the season – which I think he will – we absolutely need him on the pitch if we want to score goals.
| 1 | Wigan | Mar 16th 2010 | Aston Villa | 2 | ||||||||||||||||||||
| 54% | Possession % | 46% | ||||||||||||||||||||||
| 13 | Shots | 20 | ||||||||||||||||||||||
| 3 | On Target | 6 | ||||||||||||||||||||||
| 7 | Corners | 8 | ||||||||||||||||||||||
| 1 | Offsides | 5 | ||||||||||||||||||||||
| 27′ Caldwell | Scorers | 25′ McCarthy (OG), 63′ Milner | ||||||||||||||||||||||
| Bramble, Rodallega | Booked | Dunne | ||||||||||||||||||||||
| Sent Off | ||||||||||||||||||||||||
| 230 | Good Passes | 193 | ||||||||||||||||||||||
| 54% | CPS % | 46% | ||||||||||||||||||||||
| 54 | Bad Passes | 74 | ||||||||||||||||||||||
| 81% | Completion % | 73% | ||||||||||||||||||||||
| 16 | Interceptions | 17 | ||||||||||||||||||||||
| 43 | Tackles Won | 52 | ||||||||||||||||||||||
| 38 | Tackles Lost | 22 | ||||||||||||||||||||||
| 6 | Blocks | 4 | ||||||||||||||||||||||
| 23 | Free Kicks | 11 | ||||||||||||||||||||||
|
||||||||||||||||||||||||
| Average Position Map | ||||||||||||||||||||||||
 |
||||||||||||||||||||||||
[Original data and graphics courtesy of ESPN and The Guardian]