Statshack – Hull 0 Aston Villa 2
Written by Dan on April 22, 2010
First things first; CT scans have revealed that Jan Vennegoor of Hesselink has suffered no long-term damage following his nasty clash of heads with Richard Dunne. That’s good news indeed, it’s always a concern when someone apparently spends so long unconscious. He’ll be able to train next week and should be able to play again before the end of the season.
To the game itself. Well, we won this in the first 25 minutes and then coasted to the finish really. Kevin Kilbane could and should of scored, but I think it’s safe to assume that we could have responded by getting back into gear.
It’s hard to pick out much of real interest. The average position map shows our back four noticeably deeper than they’ve been for many games, which is curious since it wasn’t as if Hull were battering us. We really did just sit back and invite them to play.
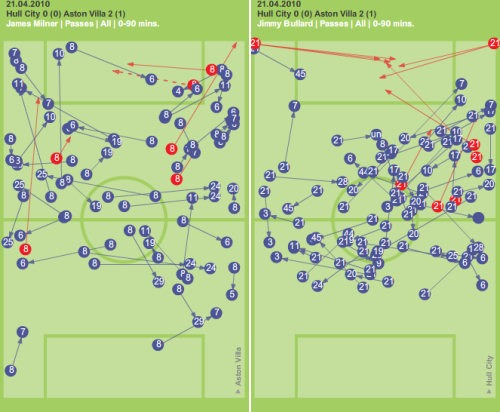
For the sake of looking at something, I thought it might be interesting to put James Milner and Jimmy Bullard’s passing maps side by side. Jimmy (on the right) made 47 successful passes and 10 unsuccessful. James (on the left) made 42 good passes and failed to connect with 6. What’s interesting is the relative spaces that the players are operating in. Against lesser opposition, Bullard’s map generally looks more like Milner’s, but in this game he was clearly under instructions to keep it tight.

One of the quirks of passing statistics that you may notice from the graphic above is that it includes throw-ins and corners. 5 of Bullard’s incomplete passes actually came from the corner, 2 were attempted crosses, leaving 3 in open play. He had 45 good passes in open play which is a 94% completion rate. Milner’s open play pass completion rate was 89%.
| 0 | Hull | Apr 21st 2010 | Aston Villa | 2 | ||||||||||||||||||||
| 49% | Possession % | 51% | ||||||||||||||||||||||
| 15 | Shots | 11 | ||||||||||||||||||||||
| 5 | On Target | 5 | ||||||||||||||||||||||
| 11 | Corners | 9 | ||||||||||||||||||||||
| 2 | Offsides | 3 | ||||||||||||||||||||||
| Scorers | 13′ Agbonlahor, 76′ Milner (Pen) | |||||||||||||||||||||||
| Cairney, Fagan | Booked | Petrov, Milner | ||||||||||||||||||||||
| Sent Off | ||||||||||||||||||||||||
| 237 | Good Passes | 232 | ||||||||||||||||||||||
| 51% | CPS % | 49% | ||||||||||||||||||||||
| 74 | Bad Passes | 63 | ||||||||||||||||||||||
| 76% | Completion % | 79% | ||||||||||||||||||||||
| 18 | Interceptions | 22 | ||||||||||||||||||||||
| 25 | Tackles Won | 36 | ||||||||||||||||||||||
| 27 | Tackles Lost | 19 | ||||||||||||||||||||||
| 2 | Blocks | 7 | ||||||||||||||||||||||
| 11 | Free Kicks | 10 | ||||||||||||||||||||||
|
||||||||||||||||||||||||
| Average Position Map | ||||||||||||||||||||||||
 |
||||||||||||||||||||||||
You can find Statshacks from other games here.
[Original data and graphics courtesy of ESPN and The Guardian]
[ad#Wallpaper – Latest]