Aston Villa Premiership Transfer Spend
Written by Dan on June 19, 2009
This is a post that will obviously be superseded when this summer’s transfer window has been closed. It’s certainly going to be another interesting summer – we know that Man Utd are more flush now than they were a few weeks ago and we have no idea how much money Man City are going to throw around. As I don’t expect any massive activity from Villa Park for a while, I figured it was a good opportunity to review the story so far, as it were.
For anyone who isn’t aware, I source the data that I use to create a lot of my stats from soccerbase.com & statto.com. A lot of the legwork for today’s exercise has already been done by transferleague.co.uk. I’m going to use a couple of tables straight from their site in a moment, but I want to make it clear at this stage that Gareth Barry’s recent transfer to Citeh is considered out of scope for this post. It will be much fairer to judge that transaction in the context of a full summer.
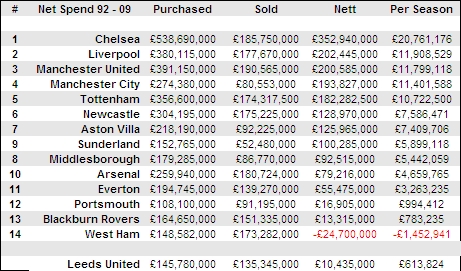
This first table shows the total transfer expenditure by key clubs since the Premiership was formed in 1992. Newcastle are slightly above Villa in average annual net spend and Arsenal significantly below – draw your own conclusions.

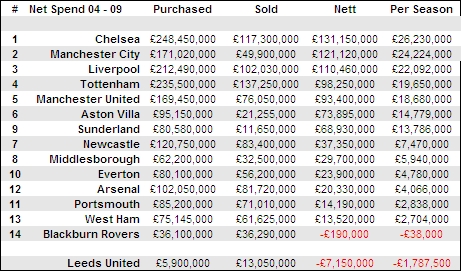
The Premiership may have been a game changer in terms of the level of money in football, but by today’s standards the transfer fees in the early years look more like fizzy pop league stuff. The following table is much more contemporary, detailing the period since Rafa took over at Liverpool in 2004.

For me, it’s Spurs that stand out in the above table. The fact that they’ve made £20m more back from sales than the next nearest team (Chelsea) is all that’s prevented them spending well over £20m net on average per season during this period. My eyes are also drawn to Arsenal – £4m net per season?? Are you kidding me?!?! Hey, when you’ve been up there for a while you can afford to spend more effort on recruiting & developing promising youngsters while financing the odd Arshavin (£15m) by selling the occasional Henry (£16m).
Anyway, this is a Villa blog after all, I just included those tables as they were there and gave some interesting perspective. I’ve pulled Villa’s numbers for each of the Premiership seasons since 1992 for your enjoyment:-
| Season | Spent | Received | Net |
| 1992/1993 | 4,400,000 | 300,000 | 4,100,000 |
| 1993/1994 | 1,235,000 | 3,730,000 | -2,495,000 |
| 1994/1995 | 14,600,000 | 5,800,000 | 8,800,000 |
| 1995/1996 | 0 | 670,000 | -670,000 |
| 1996/1997 | 14,000,000 | 3,050,000 | 10,950,000 |
| 1997/1998 | 7,530,000 | 6,250,000 | 1,280,000 |
| 1998/1999 | 22,925,000 | 16,600,000 | 6,325,000 |
| 1999/2000 | 7,200,000 | 4,500,000 | 2,700,000 |
| 2000/2001 | 18,100,000 | 14,750,000 | 3,350,000 |
| 2001/2002 | 21,800,000 | 10,050,000 | 11,750,000 |
| 2002/2003 | 2,250,000 | 5,000,000 | -2,750,000 |
| 2003/2004 | 9,000,000 | 270,000 | 8,730,000 |
| 2004/2005 | 2,350,000 | 2,150,000 | 200,000 |
| 2005/2006 | 11,000,000 | 3,555,000 | 7,445,000 |
| 2006/2007 | 24,650,000 | 3,050,000 | 21,600,000 |
| 2007/2008 | 8,750,000 | 10,000,000 | -1,250,000 |
| 2008/2009 | 48,400,000 | 2,500,000 | 45,900,000 |
| Total | 218,190,000 | 92,225,000 | 125,965,000 |
The data behind this table is available at transferleague.co.uk – the site isn’t well coded so I can’t link directly to the Villa page, just use the menu in the sidebar. You might also like to check out the ‘Comparisons’ page which shows some interesting before & after scenarios at a number of clubs. In Villa’s case they obviously break down before & after Randy Lerner bought the club. Or, to put it another way, Lerner vs Ellis:-
| Total | Spent | Received | Net | Per Season |
| Ellis | 136,390,000 | 76,675,000 | 59,715,000 | 4,265,357 |
| Lerner | 81,800,000 | 15,550,000 | 66,250,000 | 22,083,333 |
Doesn’t make very good reading does it?? If you’re concerned that Deadly Doug is being given the short end stick here by comparing all of his 14 Premiership years, which includes the somewhat less extravagant ’90’s, then fear not, we could easily compare Doug’s last 3 years with Randy’s 3 years:-
| Last 3 Yrs | Spent | Received | Net | Per Season |
| Ellis | 22,350,000 | 5,975,000 | 16,375,000 | 5,458,333 |
| Lerner | 81,800,000 | 15,550,000 | 66,250,000 | 22,083,333 |
Mmmmm, Randy’s still blowing old Doug out the water. How about putting Doug’s 3 biggest spending years – ’94/95, ’96/97 & ’01/02 – up against the Lerner years:-
| Best 3 Yrs | Spent | Received | Net | Per Season |
| Ellis | 50,400,000 | 18,900,000 | 31,500,000 | 10,500,000 |
| Lerner | 81,800,000 | 15,550,000 | 66,250,000 | 22,083,333 |
Well, there really isn’t any comparison is there?? As I said at the beginning, we’ll revisit this at the end of the summer and see where we are.
Note: You may have an eagle eye and spotted that the £66.25m net spend credited to RL here is substantially different from the £50.2m I’m currently claiming on the MON Xfrs page when they should be the same. £12m is Barry’s transfer and the other ~£4m is pretty much Steven Davis’ transfer to Fulham. I’ve gone with £4m, the database sites go with “signed”. The rest is the odd minor variance here and there. Overall, we’re in the right ball park.