One Hundred And Forty Eight
Written by Dan on April 20, 2010
Cumulative Points
Not the most revealing of graphs, but it would be remiss to leave it out. What you can see, as you’d expect once again, is that Gregory’s early performance gave him an impressive head start, but MON has steadily caught him up and now has 1 point more than JG managed over 148 games.
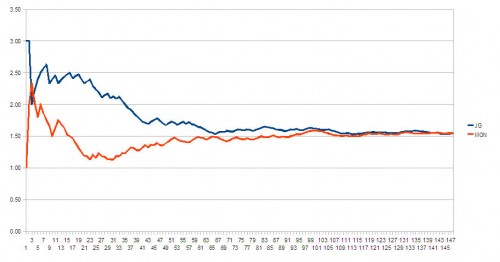
Cumulative Points per Game
Like any ratio based on number of games, this bounces around dramatically early on. What this graphs serves to show is that Gregory built up a decent Points per Game ratio early on, but it slowly degraded over time. MON did the opposite.
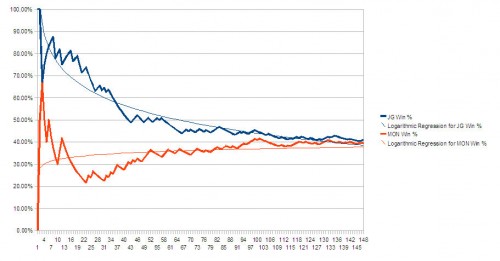
Cumulative Win Percentage
Like cumulative points per game, this is subject to a lot of variation early on, but as the number of games increase, the effect the result has on the W/D/L % is diminished. Over time though, you can see exactly what you expect by now – JG’s Win % decreases over time and MON’s increases over the same period.
I’ve added logarithmic trend lines to make it easier to see.
Cumulative Win Percentage – 38 Games Only
I’ve already used two graphs here which show how anything based on a per game ratio will be subject to exaggerated changes early on. For instance, win the first game and the Win percentage is 100%. Lose or draw the next one and it drops to 50%. The same doesn’t happen after 100 games, or even 30 for that matter.
So what I’ve done with this chart is pick up the Win% after 38 games and continue on, but only looking at the Win% for the preceding 38 games. So, we start at games 1-38, then 2-39, then 3-40 and so on until the last point plotted on the graph will represent the Win% for games 110 to 148.
After all, where we were 3 years ago is relevant, but not particularly useful in assessing current trends. This graph is much more contemporary, but I’ve added the logarithmic trend lines again to help show the overall trend.
Conclusion
Well, it’s pretty clear really, isn’t it? MON has taken his time and, yes, he’s spent a fair amount of money, but the gradual upward trend that all of these graphs demonstrate that we’re now poised to really move forward.
Next season, key players will be in their 2nd, 3rd and, in some cases, 4th seasons with the club. Some of the most exciting prospects from the academy are seriously knocking on the first team’s door and with just one or two well chosen additions, we could be in for something special next year.
Obviously there are limits to improvements and as you get closer to the zenith, the rate of improvement slows, exactly like some of the metrics shown in these graphs. Eventually you stop measuring progress in terms of wins and points, it becomes about silverware. For instance, Man Utd would find little consolation in racking up more points this season than last if they finish in second place. We’re not Man Utd just yet though.
So, assuming that there isn’t some kind of force majeure and MON leads his men out at the KC stadium as expected, congratulations on taking charge of the most Premiership games at Aston Villa. Here’s to the next 148. If the improvements continue over the next few seasons, we’ll soon be switching to measuring our success by the contents of the trophy cabinet as well!


