Statshack – Tottenham 0 Aston Villa 0
Written by Dan on February 8, 2010
This might seem like an odd question to introduce the statistics from Saturday’s 0-0 draw with Tottenham, but do you remember the 4-4 draw we had at White Hart Lane back in 2007? Of course you do!
Last week I was looking at how Aston Villa have performed based purely on passing over the last couple of seasons and was surprised to find that the 4-4 draw with Spurs contained our least number of passes during a game for the period I have records for. We managed to string just 109 passes together during that game, which made up just 24% of the total completed passes during the game.
So then, on to this season’s encounter in North London and the numbers didn’t pan out quite as poor as I anticipated. From a passing perspective; Tottenham had 56% of the total completed passes, which means, based on my categorization of 45-55% being a more or less even passing game, that they only just tipped it.
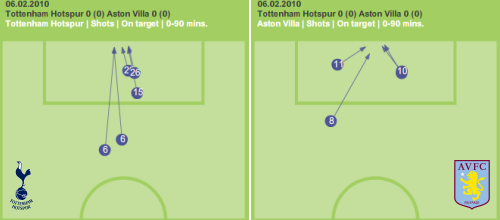
Tottenham did achieve a staggering number of shots; 33, but only 5 were on target. Villa were far more efficient, managing to get 4 shots on target themselves from 11 total efforts. It’s worth comparing the shots on target graphically:-

Ledley King was responsible for 2 of Tottenham’s shots on target, one from a corner and the other from a free kick. Jermaine Defoe had a left footed shot from just inside the box and the other two shots were long range speculative efforts from Tom Huddlestone.
John Carew had two shots on target, both from almost the same spot inside the box and Gabby’s effort came following up on the rebound from James Milner’s longer range shot.
It may be a matter of opinion, but the conventional wisdom might suggest that Tottenham are a better side now than the one we faced 2 seasons ago. I think that Aston Villa are unquestionably better and although the end result, i.e. a draw, is the same now as back then, we had a much bigger share of this game than we did last time.
To me, that’s evidence of continued progress under MON, but as ever, I wouldn’t expect you to simply take my word for it, so I’ve included the important statistics from the ’07/08 version of this fixture below so you can see for yourself.
Personally, I remain a little disappointed at the frequency that our limited attacking game seemed to break down through unforced errors, but on reflection, this isn’t a bad point at all.
| 0 | Tottenham | Feb 6th 2010 | Aston Villa | 0 | ||||||||||||||||||||
| 55% | Possession % | 45% | ||||||||||||||||||||||
| 33 | Shots | 11 | ||||||||||||||||||||||
| 5 | On Target | 4 | ||||||||||||||||||||||
| 12 | Corners | 4 | ||||||||||||||||||||||
| 3 | Offsides | 0 | ||||||||||||||||||||||
| Scorers | ||||||||||||||||||||||||
| Booked | ||||||||||||||||||||||||
| Sent Off | ||||||||||||||||||||||||
| 227 | Good Passes | 177 | ||||||||||||||||||||||
| 56% | CPS % | 44% | ||||||||||||||||||||||
| 69 | Bad Passes | 52 | ||||||||||||||||||||||
| 77% | Completion % | 77% | ||||||||||||||||||||||
| 12 | Interceptions | 13 | ||||||||||||||||||||||
| 50 | Tackles Won | 39 | ||||||||||||||||||||||
| 39 | Tackles Lost | 43 | ||||||||||||||||||||||
| 2 | Blocks | 17 | ||||||||||||||||||||||
| 14 | Free Kicks | 13 | ||||||||||||||||||||||
|
||||||||||||||||||||||||
| Average Position Map | ||||||||||||||||||||||||
 |
||||||||||||||||||||||||
Tottenham 4 – Aston Villa 4
| 4 | Tottenham | Oct 1st 2007 | Aston Villa | 4 |
| 62% | Possession % | 38% | ||
| 19 | Shots | 9 | ||
| 12 | On Target | 7 | ||
| 13 | Corners | 3 | ||
| 3 | Offsides | 1 | ||
| 20′ Berbatov, 69′ Chimbonda. 82′ Keane (pen), 90′ Kaboul | Scorers | 22′, 33′ Laursen, 40′ Agbonlahor, 59′ Gardner | ||
| Keane, Kaboul | Booked | Reo-Coker, Gardner, Carson | ||
| Sent Off | ||||
| 352 | Good Passes | 109 | ||
| 76% | CPS % | 24% | ||
| 87 | Bad Passes | 35 | ||
| 80% | Completion % | 76% | ||
| 6 | Interceptions | 13 | ||
| 39 | Tackles Won | 31 | ||
| 28 | Tackles Lost | 29 | ||
| 1 | Blocks | 10 | ||
| 15 | Free Kicks | 14 | ||
[Stats and Graphics originally provided by ESPN and The Guardian]