Statshack – Aston Villa – Chelsea 0
Written by Dan on October 17, 2010
Let’s be completely honest here, Chelsea have a considerably better side than we do and we have little practical reason to expect to beat them, yet their record at Villa Park isn’t that good. Over the last five visits now they’ve won only once, lost twice and drawn twice.
We beat them 2-1 last season despite having just 32% possession and being out-passed 407 to 167, a 29% share of the completed passes. The season before, Chelsea won 1-0 with a slightly less dominant share of the game.
However, the passing and possession statistics suggest that Villa had a bigger foot in yesterday’s game than in this same fixture in the preceding three seasons. The fact that the completed passes yesterday were the most from both teams in this fixture over the last five years might hint at the open, flowing nature. Or that both sides just moved the ball around with little interest in getting forward, but that doesn’t match my assessment of the game.
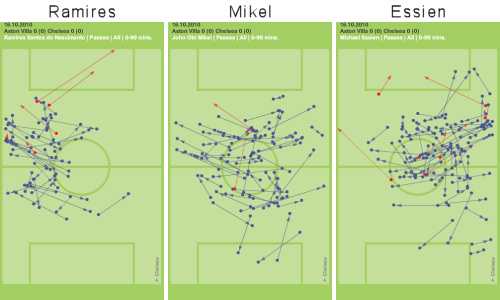
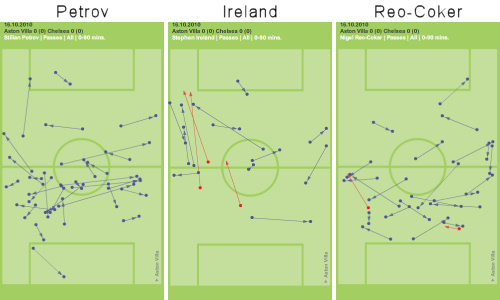
But the gap between the two teams in terms of quality on the ball remains significant. To illustrate the scale of the difference I thought I’d look at the comparative passing maps of the two sets of midfield three.
Ancelotti played the side he said he would in the 4-3-3 he said he would. Ramires, Mikel and Essien are all strong, holding, box-to-box types and sat in the middle of the park, Mikel the more central, deeper of the three, Ramires on the left, Essien on the right. The passing map below reveals how well disciplined they are at operating in their own areas of the pitch.
It may have been forced on him by Albrighton’s illness, but Houllier put together the 4-2-3-1 many of us have wanted to see for some time. Petrov and Reo-Coker as the double pivot, Ireland as the central attacking midfielder charged with getting forward to support Carew, which almost paid off inside the opening few minutes.


It’s a pretty sobering graphic, isn’t it?
The Chelsea trio completed 159 passes, 36% of the team total. Essien was the top passer on the pitch with 65 completed passes. The three Villa players completed 64 passes between them, less than Essien alone, which was 25% of Villa’s total.
Clearly that triangle of players operate as the central distribution hub and there’s a great deal of room for improvement. However, one thing that’s difficult to quantify statistically is how they operated as a unit when they didn’t have the ball, and there I think they did pretty well.
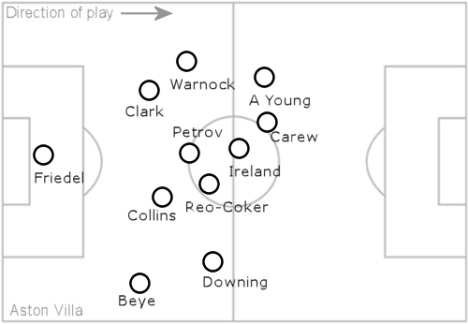
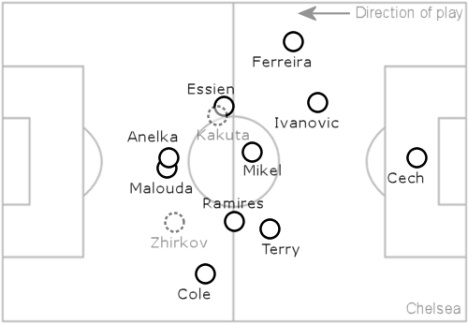
Average Position Map
Houllier might take it as a compliment that his last two opponents both went back to the drawing board at half time and made a tactical switch, an admission, perhaps, that they got it wrong, or at least recognised that it wasn’t working.
Ancelotti brought off Kakuta, who was struggling to get into the game, and brought on Zhirkov to run the left flank, Malouda shifting to a central-right position supporting Anelka. Kakuta and Zhirkov are both show on the graphic as dotted lines, Malouda’s position is a reflection of the tactical switch.
Regardless, Chelsea’s focus down their left, our right, is not difficult to see, the relative position of Beye and Downing providing adequate evidence. In fact, 44% of their attacks were through the left third of the pitch, 31% through the middle and just 24% went down the right. Villa focused 53% down Ash’s side of the pitch, just 18% through the middle and 29% down the right.
Overall, a clear improvement in terms of how we measure up to Chelsea at Villa Park, but the result no better than anything in the past. We might have nicked it at the death, both sides could have scored a couple each during normal time.
Neither did, all sensible observers are satisfied, if not very pleased, with a draw.
| 0 | Aston Villa | October 16th 2010 | Chelsea | 0 | ||||||||||||||||||||
| 39% | Possession % | 61% | ||||||||||||||||||||||
| 13 | Shots | 15 | ||||||||||||||||||||||
| 2 | On Target | 4 | ||||||||||||||||||||||
| 9 | Corners | 5 | ||||||||||||||||||||||
| 2 | Offsides | 3 | ||||||||||||||||||||||
| Scorers | ||||||||||||||||||||||||
| Warnock, Ireland, Clark, Young | Booked | Essien, Terry, McEachran | ||||||||||||||||||||||
| Sent Off | ||||||||||||||||||||||||
| 254 | Good Passes | 442 | ||||||||||||||||||||||
| 36% | CPS % | 64% | ||||||||||||||||||||||
| 46 | Bad Passes | 74 | ||||||||||||||||||||||
| 82% | Completion % | 86% | ||||||||||||||||||||||
| 28 | Interceptions | 13 | ||||||||||||||||||||||
| 31 | Tackles Won | 37 | ||||||||||||||||||||||
| 28 | Tackles Lost | 33 | ||||||||||||||||||||||
| 53% | Success % | 53% | ||||||||||||||||||||||
| 1 | Blocks | 3 | ||||||||||||||||||||||
| 15 | Free Kicks | 13 | ||||||||||||||||||||||
|
||||||||||||||||||||||||
| Average Position Maps | ||||||||||||||||||||||||
 |
||||||||||||||||||||||||
 |
||||||||||||||||||||||||
You can find Statshacks from other games here.
[Original data and graphics courtesy of ESPN and The Guardian]