Statshack – Newcastle 6 Aston Villa 0
Written by Dan on August 23, 2010
Apologies for the delay. This one hurts, it took some serious motivation to pull it together. I still haven’t seen the whole game, not sure I want to right now, so I can’t really comment on what went wrong. You’ve no doubt all got your own ideas.
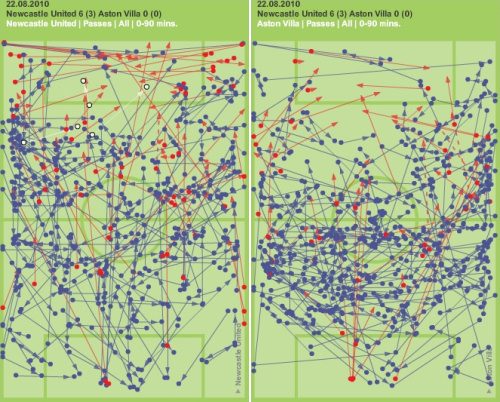
I would like to pause briefly to look at the team passing maps side by side though. It’s frequently the case that this level of data won’t reveal much, it’s just a mass of blue and red lines, but this game is a little different and illustrates an important point beautifully.
I know one or two people will focus on a single metric, predominantly the number of passes, to determine the quality or otherwise of the football on display, but that view is completely undone by games like this. Villa actually completed more passes than Newcastle, a 53% share, and a better completion rate, 86% to Newcastle’s 79%, but Newcastle thrashed us 6-0.
The passing maps below illustrate perfectly why all those passes achieved nothing. Villa’s map on the right shows the bulk of those passes took place in our own half and were lateral passes. By contrast, look at Newcastle on the left, look at how many if their passes are vertical, forward passes.

You can pass the ball around among the back four all day long, but you don’t score many goals without getting into the final third. Here’s the same two graphics from above isolating the final third of the pitch and you can see how much busier Newcastle were. It doesn’t matter how many of those lines are red, they peppered our box and it paid off, goals 2 through 5 essentially coming from second phase play following failed attempts to clear our lines.

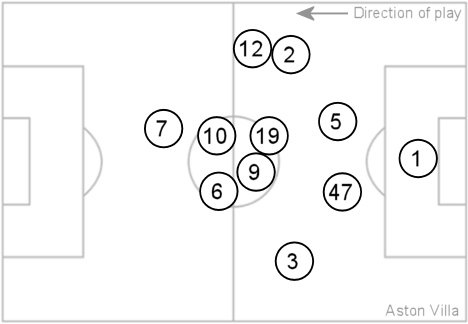
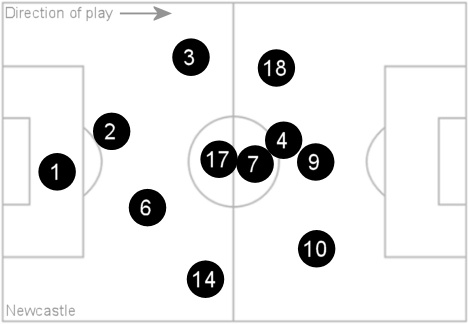
So, for what it’s worth, here’s the rest of the stats and a new version of the average position map which now includes the opposition. We didn’t have a single shot on target during the 90 minutes, Steve Harper was largely a spectator.
And we had a penalty. Shocking.
| 6 | Newcastle | August 22nd 2010 | Aston Villa | 0 | ||||||||||||||||||||
| 50% | Possession % | 50% | ||||||||||||||||||||||
| 17 | Shots | 6 | ||||||||||||||||||||||
| 11 | On Target | 0 | ||||||||||||||||||||||
| 10 | Corners | 2 | ||||||||||||||||||||||
| 1 | Offsides | 5 | ||||||||||||||||||||||
| 12′ Barton, 31′, 87′ Nolan, 34′, 67′, 90′ Carroll, | Scorers | |||||||||||||||||||||||
| Barton, Smith, Perch | Booked | Reo-Coker | ||||||||||||||||||||||
| Sent Off | ||||||||||||||||||||||||
| 258 | Good Passes | 288 | ||||||||||||||||||||||
| 47% | CPS % | 53% | ||||||||||||||||||||||
| 70 | Bad Passes | 48 | ||||||||||||||||||||||
| 79% | Completion % | 86% | ||||||||||||||||||||||
| 17 | Interceptions | 22 | ||||||||||||||||||||||
| 34 | Tackles Won | 28 | ||||||||||||||||||||||
| 31 | Tackles Lost | 36 | ||||||||||||||||||||||
| 52% | Success % | 44% | ||||||||||||||||||||||
| 2 | Blocks | 4 | ||||||||||||||||||||||
| 18 | Free Kicks | 16 | ||||||||||||||||||||||
|
||||||||||||||||||||||||
| Average Position Maps | ||||||||||||||||||||||||
 |
||||||||||||||||||||||||
 |
||||||||||||||||||||||||
You can find Statshacks from other games here.
[Original data and graphics courtesy of ESPN and The Guardian]