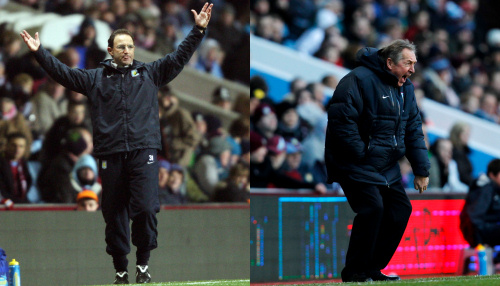
What’s the difference between Houllier’s and O’Neill’s first 25 league games?
Written by Dan on March 20, 2011

There’s a lot of emotion, anger and fear floating around the Villasphere at the moment so I’m going to tread carefully here. I’m not looking to make any particular point, but I do want to correct one or two claims I’m seeing which are factually inaccurate.
Facts are what I do, I’ll leave the opinion to you the reader.
The question in the headline might draw a multitude of answers, and possibly some less than savoury language, but I’m talking in terms of points. You know, wins, draws and losses. Just the facts ma’am.
Gerard Houllier took a bigger gamble than he probably realised when he picked the team he did at Eastlands and it’s fair to say that it backfired every bit as badly as Martin O’Neill’s team selection for Moscow. Probably more so.
The cost of failing to pick up a single point in the last two league games to Aston Villa Football Club is obvious (it can be seen in the table if you’re uncertain), but the cost to Houllier’s personal record is also significant.
I compiled the records over the first 25 top flight league games for Aston Villa managers taking over the reigns with the club in the top tier since World War II and Houllier is in the relegation zone, as you might expect. But like the current Premier League table, consider what a difference just two points in the last two games would have made to this table:
First 25 league games at Aston Villa in the top flight
| Manager | Division | Season | Points | % Avbl Pts |
| John Gregory | Premier League | 1998/99 | 56 | 74.67% |
| Tony Barton | Div One (Old) | 1982/83 | 41 | 54.67% |
| Alex Massie | Div One (Old) | 1946/47 | 38 | 50.67% |
| Ron Atkinson | Div One (Old) | 1991/92 | 37 | 49.33% |
| David O’Leary | Premier League | 2003/04 | 36 | 48.00% |
| George Martin | Div One (Old) | 1951/52 | 34 | 45.33% |
| Graham Turner | Div One (Old) | 1984/85 | 34 | 45.33% |
| Brian Little | Premier League | 1994/95 | 31 | 41.33% |
| Eric Houghton | Div One (Old) | 1953/54 | 29 | 38.67% |
| Martin O’Neill | Premier League | 2006/07 | 29 | 38.67% |
| Jozef Venglos | Div One (Old) | 1990/91 | 28 | 37.33% |
| Dick Taylor | Div One (Old) | 1964/65 | 26 | 34.67% |
| Gerard Houllier | Premier League | 2010/11 | 26 | 34.67% |
| Graham Taylor | Premier League | 2002/03 | 25 | 33.33% |
| Billy McNeill | Div One (Old) | 1986/87 | 24 | 32.00% |
That’s right, he could have been up there with Dr. Jo! Three points and he’d have tied with Martin O’Neill.
Yes, that’s all it is, three points. Here’s how the two records from their respective first 25 league games stack up in a little more detail:
| W | D | L | GF | GA | GD | Pts | |
| Martin O’Neill | 6 | 11 | 8 | 27 | 31 | -4 | 29 |
| Gerard Houllier | 6 | 8 | 11 | 31 | 42 | -11 | 26 |
Not that simple
Now, of course, there are a host of mitigating factors in both cases, I doubt fans would be unfurling protest banners if it were really as simple as 26 points vs 29 points. Still, you could fill the comments section below with hundreds of factors each manager had going for and against them during this period analysed, but the fact remains that the difference in record comes down to three losses instead of three draws.
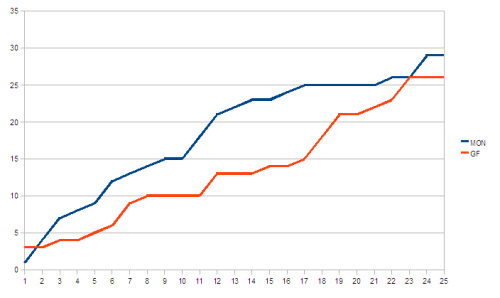
Even more startling, at the 23 game mark, both managers had amassed 26 points. MON’s side won game 24, a 2-0 home win against Watford, the first win in a dozen games at the time, and it took an 86th minute own goal from Gavin Mahon and an injury time goal from Gabby to grab the points from an otherwise even encounter.
Incidentally, Watford were at the foot of the table with 12 points prior to kick off. We were in 15th. MON’s team weren’t as fortunate in game 25, losing 3-1 at St James’ Park.
The graph below shows how MON opened his account with a nine game unbeaten run, but stalled after a poor run of form. From game 14 to 23 Houllier closed the gap from a 10 point deficit to nothing, but blew it with the last two games.
Martin O’Neill vs Gerard Houllier: Cumulative points during first 25 league games

A particularly crucial difference is that MON’s 25th game was also the 25th game of the season and he was still riding reasonably high on goodwill alone. We were 14th after those 25 games, as we are today, but we were nine points clear of West Ham in 18th and there wasn’t any real danger of being sucked into the mire. (West Ham were not relegated that season by the way).
Houllier’s 25th game was our 30th of the season, his arrival wasn’t met with anything like the same acclaim as O’Neill, he’s come to a club with higher expectations than the one MON inherited and he hasn’t helped himself by compounding poor results with bizarre PR gaffes.
Time is running out in a ridiculously tight bottom half of the table where just six points separate 11th from bottom. There is absolutely no margin for error now.
And therein lies the fear factor that makes people panicky. Eight games remain, I’ll repeat the point I’ve made several times of trying to avoid including the final two games against Arsenal and Liverpool, meaning we’ve really got to grab 10 points from the next six games. Based on the performance over the last 25 games, certainly the last two, it’s looking increasingly unlikely.
However, that’s based on chasing a theoretical threshold of safety. It may take more than 43 points, it may take less, all that matters is not being among the three worst performers after 38 games.
Something has to change, improvements have to be found. Many fans think that change and improvement has to mean the manager. Many others feel it’s a bigger gamble to jettison the incumbent than it is to stay the course.
I can’t tell you the answer, the future cannot be known for sure, but if they play the way they did against Bolton, they’ll win more than they lose. If they play the way they did against Wolves, we’re in big, big trouble.