3 Years Of Martin O’Neill – Part One
Written by Dan on August 18, 2009
Some time ago I decided to take a statistical look at Martin O’Neill’s first 100 league games for no other reason than it was an interesting milestone. The first table in that post showed MON’s first 100 games up against the record of the other manager’s first 100 games – well, almost in Ron Atkinson’s case. The second table puts that same 100 game record against other manager’s career league records at Villa. (Premiership only).
Interestingly, there’s a little factoid floating around at the moment that Villa have only won two of the last fourteen Premiership matches, acquiring just 11 points in the process. 11 points in 14 games can be extrapolated over a season to equal just 30 points – which as we all know, get’s you relegated!!
I’m frequently guilty of employing extrapolation myself, so it would be a little disingenuous to point out that zero points from one game can be projected to zero points from 38 games, but it’s true. Just saying.
If we’re on the basic math tip for a moment, it’s worth noting that Wigan’s visit to Villa Park was MON’s 115th in charge. (Under the circumstances it’s quite ironic that the 100th game was also Wigan at VP). As things have apparently gone so astray in the last 14 or so games, it seems like a good opportunity to take another look at Villa’s performance since MON took control.
Also, 38 games x 3 seasons = 114 games. We endured 3 seasons of O’Leary, so we’re now able to make a direct comparison of MON’s 114 games against DOL’s 114. Actually, I’m not sure of the entertainment value of such a one sided fight, let’s throw in John Gregory and Brian Little to keep it competitive.
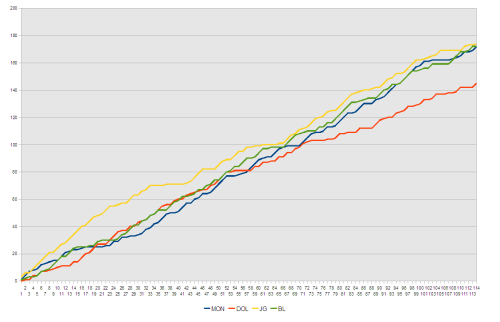
The first thing I want to look at is a graph showing how the four managers accumulated their points in the Premiership over their first 114 games. Yes, I realise that there’s a lack of parity between MON & DOL, who both have 3 full seasons in charge, and JG & BL, whose 114 games are made up from starting and finishing mid-way through a season. Too bad.
There’s a number of things that stand out from this chart. Firstly, look at the pace John Gregory’s side racked up points in the beginning, it’s staggering. After 23 games he had accumulated 55 points, which is 25 points more than any of the other 3 managers.
It’s a pity that the first 10 games belonged to the tail end of the ’97/98 season, where he dragged us up from 14th to 7th place. Since that form continued into the following 13 games, at the beginning of the ’98/99 season, Villa occupied the top of the table for several months. Sadly, as ever, the form tailed off and Villa were left holding 6th place when the curtain closed.
MON’s first 9 games were almost as impressive, unbeaten until the 3-1 loss at Anfield. You’ll also notice that MON’s chart flat lines somewhat around the 15th game and, although recovers pace, languishes behind the other 3 managers until his 58th game in charge (2-1 win at who else but Wigan!) when he finally gets his nose in front of DOL, who was flat lining himself at the time.
From there MON has slowly chipped away at Gregory and Little’s records. After 114 games MON & BL both have 172 points, JG 174 and DOL 145.
Hopefully you will also notice where MON’s line goes horizontal again towards the top of the chart – you should do, this is the infamous end of season form we’re all so concerned about. Without such a dip, 4 straight losses for instance, it’s clear that MON could easily have matched, if not edged, Gregory’s 174 point total.
It’s surely just coincidental that all three of these top managers dipped in form around the same time as it would be at different times of the seasons. Brian Little lost 4 in a row – Leicester, Blackburn, Newcastle & Spurs.
Gregory’s run of losses was far more respectable, although 5 of them – Man Utd, Chelsea, Liverpool, Man Utd & Leeds.
Martin O’Neil was sequentially vanquished by Man City, Spurs, Liverpool & Man Utd.
Hopefully this graph illustrates that although a dip in form can look very alarming at the time, when you stand back and look at the big picture, it’s but a blip. The trick is spotting when the chart’s trajectory is changing for the worse long term – as is clearly visible with DOL – and when it’s just a minor adjustment. Unfortunately, that can often only be known for certain with hindsight.
The most obvious point to derive is that over the three seasons, from a league points perspective, MON is very much on par with Brian Little & John Gregory. That may, or may not, reassure you.
Where MON goes from here is intriguing. John Gregory’s career record over 148 league games at Villa improved slightly over his first 3 years. On the other hand, Brian Little’s overall Premiership record deteriorated a little compared to the first 114 games.
We’ll get hands dirty with that sort of data in part two.
