3 Years Of Martin O’Neill – Part Two
Written by Dan on August 18, 2009
In part one we looked at a graphical representation of four Aston Villa managers accumulating points in the Premiership over the course of their first 114 games at Aston Villa – roughly a 3 year period. John Gregory was in first place with 174 points, Martin O’Neill and Brian Little were tied on 172 points and David O’Leary was predictably bringing up the rear with 145 points.
We’re now going to look at the data behind the chart to compare the manager’s records in more detail.
To add a little context, I want to borrow some data from The First 100 showing our four subjects’ performance over their first 100 Premiership games.
| Manager | Plyd | Won | Drawn | Lost | GF | GA | Pts |
| JG | 100 | 45 | 27 | 28 | 134 | 102 | 162 |
| MON | 100 | 41 | 35 | 24 | 152 | 116 | 158 |
| BL | 100 | 42 | 29 | 29 | 128 | 95 | 155 |
| DOL | 100 | 33 | 31 | 36 | 120 | 129 | 130 |
We’re working with 100 games here, so naturally I left out the percentages. For example, JG’s Win/Draw/Loss expressed as percentages would be 45%/27%/28%. Goals For per Game is 1.34, Goals Against per Game 1.02 and Points per Game 1.62. Pretty straightforward.
As we discovered in part one, MON, JG & BL all had significant runs of very poor form coincidentally occurring around the 104 to 110 game mark. DOL just continued being crap, just a bit crapper. Naturally this means that we should expect their records over 114 games to look a little poorer than the table above showing 100 games.
| Manager | Won | Drawn | Lost | Total | Points | GF | GA | GF/GA Ratio | GF/Gm | GA/Gm | Pts/Gm | |||
| JG | 48 | 42.11% | 33 | 28.95% | 34 | 29.82% | 114 | 174 | 147 | 120 | 1.23 | 1.29 | 1.05 | 1.53 |
| MON | 44 | 38.60% | 40 | 35.09% | 31 | 27.19% | 114 | 172 | 168 | 140 | 1.20 | 1.47 | 1.23 | 1.51 |
| BL | 47 | 41.23% | 32 | 28.07% | 36 | 31.58% | 114 | 172 | 143 | 115 | 1.24 | 1.25 | 1.01 | 1.51 |
| DOL | 37 | 32.46% | 34 | 29.82% | 43 | 37.72% | 114 | 145 | 135 | 151 | 0.89 | 1.18 | 1.32 | 1.27 |
No surprises there. MON retains the lowest rate of games lost – 27.19% – and the most draws – 35.09%. By the way, you do get your money’s worth, MON has the lowest number of goalless draws – 9.65%. While we obviously need to reduce the losses, it’s the draws that have to get turned into wins.
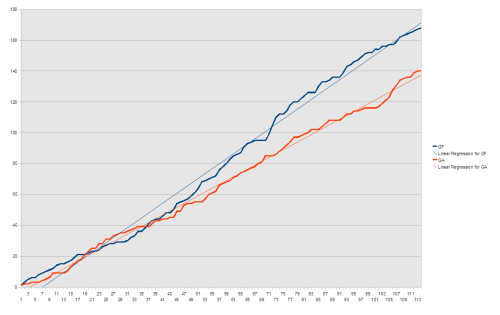
That’s blindingly obvious and you certainly don’t need a bunch of graphs and tables to work that out!! But there is one trend that’s slightly alarming because I don’t think any of us can see an immediate solution. The goals are drying up at the right end and too many are going in at the wrong end.
OK, OK, ‘duh!!’ you’re probably thinking, ‘that’s why we’re losing!!’ Correct again, but take a look at this chart showing Goals For and Goal Against with trend lines plotted.
Yeah, that’s a concern for sure. Villa have always managed to share the goals around the team, but without a reliable striker it’s hard to see where they’re going to come from at the moment. At the back, we’re shipping goals, Laursen is a huge loss and again, it’s difficult to see where the fix for this is coming from.
So Martin O’Neill is definitely at a point where these issues need grabbing by the scruff of the neck to avoid a step backwards. A step backwards is exactly what a lot of the pundits out there are predicting for Villa this season and it’s a fear that a growing proportion of fans are vocalizing at the moment.
As I touched on towards the end of part one, after nearly 3 years at the club, Brian Little had a points per game ratio of 1.51 – the same as MON – but was trending in the wrong direction. He never recovered; 7 losses, 5 draws and 4 wins later he resigned with his record down to 1.45 pts/gm.
But that’s no omen, John Gregory managed to regain a bit of momentum and when he quit he had a record of 229 points from 148 games – 1.55 pts/gm.
As I mentioned previously, Villa were in 14th place when Gregory came in and he steered us to 7th. He followed up with two 6th places and an 8th, an FA Cup Final and a League Cup Semi-Final. When he quit, some “fans” were hanging a “Gregory Out” banner from the stands.
I suppose that’s the real illustration of where the bar is set and the Villa fans are always classy when it comes to letting the manager know that more is expected.
