The Big Picture – League Points History
Written by Dan on June 7, 2010
I’ve been meaning to get to this for some time and as transfer hungry fans start rolling out the old memes, such as Martin O’Neill “has taken us as far as he can” and is “useless in the transfer market”, it seems as good a time as any. I want to put the last few seasons, and especially 2009/10, in a larger context so that the progress and trend can easily be seen by everybody. So it’s time for a couple of graphs.
38 Games / 3 Points For A Win
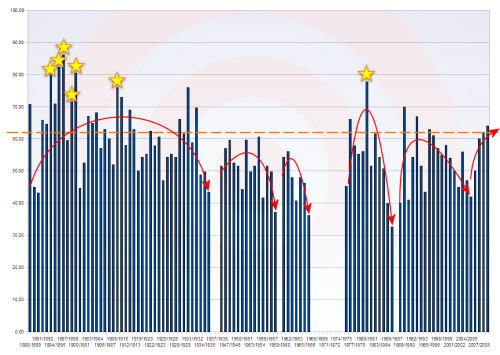
I’ve plotted our league points total for every season in the top flight going all the way back to the very first season, 1888/89, in the graph below. There’s two problems that make a straight comparison, without any alteration, impossible, or at least valueless.
Firstly, the number of teams in the league has varied over the years meaning that the number of games played in season has also varied from just 22 games in the very early years to 42 games during much of the old First Division and first three seasons of the Premier League.
Secondly, prior to 1981, the league tables were calculated using 2 points for a win rather than the 3 point system which is standard throughout the world today.
The solution is simple, I’ve recalculated the seasons based on 3 points for a win and extrapolated or interpolated the new totals to the equivalent of 38 games. It’s simply a case of dividing the total points by the actual number of games played and then multiplying that points-per-game value by 38. Obviously that means that the bigger the difference between the actual number of games played and 38, the bigger the potential error of margin. In simple terms, that means we should be more skeptical the further we go back, but I always maintain the value of making comparisons is reduced the further back in time we travel in any case.
(you can click on the chart below for the full sized version)
I’ve annotated the graph with a few things and no gold stars for guessing what the gold stars indicate!
The graph shows the recalculated points totals for each season in the top flight only. The gaps represent years in the lower leagues following relegation.
The orange dashed line is at the 62 point mark; the average of our last 3 seasons. As you can see, in modern times (since we returned to the top flight after 8 years in the old Second and Third Divisions) there have been just 5 seasons prior to 2009/10 where we’ve finished above that threshold. Before that, you’d have to go all the way back to 1933.
The red arrowed lines indicate my own interpretation of our fortunes during each period in the top flight, there’s nothing scientific about them at all. Most people are aware of the theoretical threshold of safety from relegation around the 40 point mark and it easy to spot that we indeed fell below that line the last three times we’ve suffered the humiliation of dropping down a level (or two).
Though we’ll thankfully never know for sure, once again this is a graph which shows we were on a path heading for doom in the years leading up to 2006. Aside from O’Leary’s sixth place finish in what I maintain was a weak Premier League in 2003/04 – a mere blip – the trend of decline could not be more blatant. DOL finished his Villa reign with a 45 point season, which was good enough to secure 16th place and survival. Just.
From then, it’s been 4 seasons of year on year improvement under Martin O’Neill.
“Martin O’Neill Has Taken Us As Far As He Can”
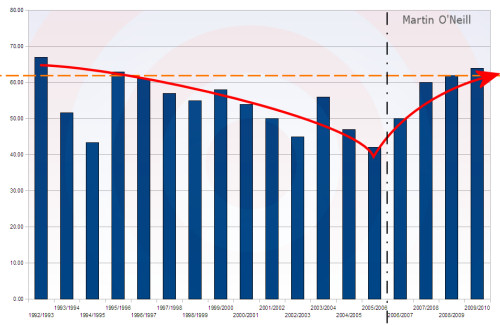
I read this all the time. I don’t know what it’s based on, but it certainly isn’t reality. Let’s take the same chart above and focus exclusively on the Premiership years:-
Now honestly, looking at the chart above, do you see evidence that we’ve gone as far as we can? I certainly don’t!
Of course, we’re not in a vacuum and what’s going on at the clubs around us is relevant. While we’ve improved, Tottenham evidently leaped forward at a greater rate under Harry Redknapp. Can they match last season’s league performance while juggling the rigours of Champions League competition next season? We shall see, but it won’t be easy.
Man City have spent a couple of hundred millions pounds in the last two seasons and finished last season 3 points shy of the 70 points Mark Hughes claimed they were on track for before he was shown the door. It’s safe to assume that they’ll spend big this summer – we know that they’d like to give us upwards of £20m for James Milner – but will their spending bring in the right players to move forward again, or will they descend into a cycle of firing and hiring managers for perpetually under performing?
We don’t need to mention the situation at Liverpool right now, but what about Arsenal? Will they cling on to Cesc Fabregas? Man Utd are a team in transition and are reliant on a lot of their old guard. Their financial clout remains unclear, but it would be impressive to say the least if they can repeat this past season’s achievements without strengthening a side at high risk of suffering debilitating injuries.
And once again, if Everton can hook up a decent start to a season, and the fixture calendar may have an influence on that, they’ll no doubt be in the mix nine months later. We probably should not discount Newcastle at least being a “spoiler” next term.
The next season is promising to be extremely competitive and I’ve a feeling that if we can find an extra couple of points improvement once again, preferably at the expense of direct rivals, we’ll be knocking on the door of Champions League qualification. Easier said than done, but without wanting to labour a familiar opinion; a creative midfielder and a proven goal scorer will go a long way towards achieving that goal.
Not selling key players to immediate rivals may prove equally important too!

