This Season vs Last Season #05
Written by Dan on February 1, 2010
23 down, 15 to go. It must be time to compare progress this season with last season again. You should know the rules by now, but if you’re new to this; I not only compare where we are now compared to the same number of games last season (chronological), I also compare the same fixtures with the 3 promoted teams replacing the 3 relegated teams (apples for apples).
It’s inescapable that we are 7 points worse of this year than we were last year at the same point, but when you compare the corresponding fixtures you can regain you breath and see that we’re still 5 points ahead.
While we’re even in the goals scored column, our improvement defensively is very impressive indeed. The 2-0 over Fulham was a great start at getting back on track.
| Season | Pld | W | D | L | GF | GA | Pts |
| 2009/10 | 23 | 11 | 7 | 5 | 31 | 18 | 40 |
| 2008/09 Chron | 23 | 14 | 5 | 4 | 38 | 24 | 47 |
| 2008/09 Apples | 23 | 9 | 8 | 6 | 31 | 30 | 38 |
Since we’re always comparing the same number of games, whether chronologically or apples for apples, there’s no real value in looking at relevant ratios or percentages. However, now we’re at the 60% stage of the season I’ll introduce a table with just that data so that we can start making some projections to the end of the season.
| Season | Pts/gm | GF/gm | GA/gm | GF/GA | W% | D% | L% |
| 2009/10 | 1.74 | 1.35 | 0.78 | 1.72 | 47.8% | 30.4% | 21.7% |
| 2008/09 Chron | 2.04 | 1.65 | 1.04 | 1.58 | 60.9% | 21.7% | 17.4% |
| 2008/09 Apples | 1.52 | 1.35 | 1.30 | 1.03 | 39.1% | 34.8% | 26.1% |
As we now have the ‘per game’ numbers here, it’s very easy to simply multiply by 38 to see where we’ll end up if we maintain the current pace. If we keep accumulating points at an average of 1.74 points per game we’ll finish the season on 66 points. Obviously that would be an improvement on last season, but 66 points would only have managed a top 4 finish in 4 of the last 14 Premiership seasons. We probably do need to pick up a few extra points along the way somewhere to qualify for the Champions League.
The problem with extrapolating data in this fashion is, of course, the assumption that the pace will continue to the end of the season. We all know that wasn’t the case last season. In fact, the overall points per game ratio was 1.63, slipping from the rate of 2.04 after 23 games as shown above because of an appalling return of just 15 points from the last 15 games. You shouldn’t need telling that’s a rate of 1.00 points per game!! Not good.
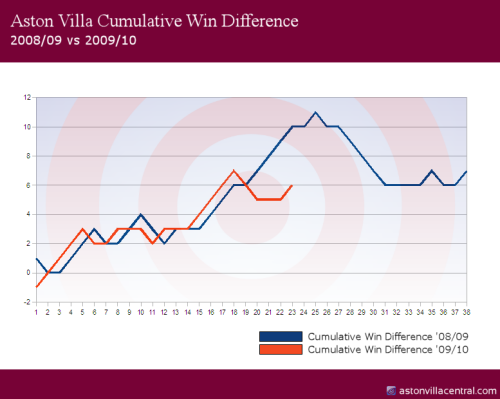
Cumulative Win Difference
Not so long ago we took a look at Aston Villa’s Premiership history graphically using a metric I called “Cumulative Win Difference’. I’ve plotted the same data here, but put this season against last season. You can clearly see the disastrous collapse in form last year that we must avoid this time out. Hopefully you’ll see the same thing that I do though and that’s that it won’t take much more than a reasonably respectable level of form between now and the end of the season to end up much better off.

As ever though, it won’t be easy and the next two fixtures present a significant obstacle – Tottenham away and Man Utd at Villa Park. In fact, looking at the current table, both fixtures are vitally important to our season, especially the Spurs game.