This Season vs Last Season #11
Written by Dan on January 3, 2011
We’re now 20 games into 2010/11 so it’s time to compare this season with 2009/10 once again. As we’re only four points better off than the last post, the gap to last year, however you slice or dice it, has grown. After the first 20 games last year, we had 35 points and by comparing the same fixtures, apples for apples, we had 32 points compared to 21 points this year.
We’ve conceded twice as many goals than we had at this same stage last year, but continue to struggle at the other end, averaging barely more than a goal per game. We’ve failed to score in seven games so far compared with only three during the same period last season and kept only four clean sheets this term, but seven last year.
Crucially, we haven’t kept a clean sheet since the Birmingham derby at the end of October, that’s 10 games now. Houllier has correctly identified that as a key issue and will have to be a point of focus for Sunderland at Villa Park on Wednesday; I don’t think there was ever much reasonable expectation of a clean sheet at Stamford Bridge, even with four centre halves!
| Season | Pld | W | D | L | GF | GA | Pts |
| 2010/11 | 20 | 5 | 6 | 9 | 23 | 36 | 21 |
| 2009/10 Chron | 20 | 10 | 5 | 5 | 29 | 18 | 35 |
| 2009/10 Apples | 20 | 8 | 8 | 4 | 30 | 23 | 32 |
It has to be recognised, as it could be hugely significant for our whole season; the result at Chelsea, while it hasn’t made a huge dent into the comparisons here, the 3-3 draw is a considerable improvement on the 7-1 drubbing last season.
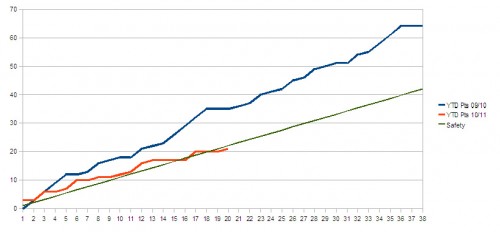
However, no one should pretend that we’re no longer in the mire. We are, right up to our waist. For the first time this season, based on our current pace, our projected finishing points tally is right on the bubble of the perceived safety of 40 points. This season is likely to require more though, the pace must be improved.
| Season | Pts/gm | GF/gm | GA/gm | GF/GA | W% | D% | L% |
| 2010/11 | 1.05 | 1.15 | 1.80 | 0.64 | 25.0% | 30.0% | 45.0% |
| 2009/10 Chron | 1.75 | 1.45 | 0.90 | 1.61 | 50.0% | 25.0% | 25.0% |
| 2009/10 Apples | 1.60 | 1.50 | 1.15 | 1.30 | 40.0% | 40.0% | 20.0% |
| Projections: | 40 | 44 | 68 |
Graphs
As we’re past the half way point, there’s some value in bringing the charts back to plot our relative fortunes graphically and it’s every bit as disturbing as you might imagine.
The regular reader will be familiar with both techniques I’m using here, but for those that haven’t seen these before, I’m simply plotting the cumulative effect on goal difference and applying the same principle to “win difference”.
The cumulative win difference chart simply increases by one with a win, stays the same with a draw and is decreased by one for a loss. It’s more useful as a general illustration of fortunes over a larger period of time, but does a fine job here for our comparative purposes.
Cumulative Goal Difference
Cumulative Win Difference
Cumulative Points
I wouldn’t normally include this chart as it can only ever increase or stay the same, poor runs of form can easily be lost and comparisons with previous seasons generally show two lines following a similar path. However, as we’re so far behind last season, that’s not the case and it’s worth annotating a projection of “safety” which I’ve arbitrarily chosen as 42 points.
Greater context
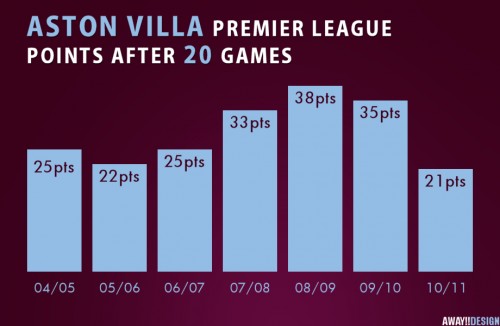
This is not the worst Premier League season we’ve seen at this stage, that honour belongs to 1994/95’s 17 point haul, but it’s certainly worse than anything in recent memory.
Incidentally, the 38 points we had in 2008/09 were just a point shy of the best Premier League season at 20 games; 1998/99, but the 2-1 win over West Brom in game 21 opened a purple patch of eight games that provided the record points haul at that stage of a Premier League season.
Sadly, as you will no doubt recall, that hot run of form tailed off and we limped to the finishing line taking 10 points from the final 10 games, ending the 2008/09 season with 62 points. It would take title winning form from here to the end of the season just to match that now.
Right now, I’d settle for the 1.39 points per game average we’ve seen in the league so far this century prior to this season, that will get us to the finish line safely to re-group in the summer. Hopefully I can report that we’re on the road to achieving that when the series continues at the 25 game mark.


