This Season vs Last Season #12
Written by Dan on February 9, 2011
I was planning on running this series every five games, but for one reason or another I didn’t get to it after the 25th game of the season; the 3-1 loss at Old Trafford. I really wish I had because now 26 games into the season, what I have to share isn’t pleasant.
After the 2-2 draw against Fulham at Villa Park we now have 29 points. Unfortunately, that’s our worst points haul from the first 26 games in the history of the Premier League, forcing me to open my records from the time Sky forgot to find a worse year.
You may have already guessed the season, it was 1986/87 when we were sat in 21st place with just 24 points from the first 26 games. We all know what happened that year, don’t we? But that won’t be happening this year so let’s get on with the numbers.
We’ll start with the usual table comparing this season against last season, both chronologically and on an apples to apples basis by using identical fixtures with the three promoted teams mapped to the three relegated teams they replaced.
| Season | Pld | W | D | L | GF | GA | Pts |
| 2010/11 | 26 | 7 | 8 | 11 | 30 | 45 | 29 |
| 2009/10 Chron | 26 | 12 | 9 | 5 | 37 | 21 | 45 |
| 2009/10 Apples | 26 | 12 | 10 | 4 | 38 | 26 | 46 |
As we head toward the business end of the season the difference between the chronological and apples to apples comparisons is diminished. There’s no point sugar coating it, however you look at it, it’s a mess.
So let’s move on to the ratios and projections.
| Season | Pts/gm | GF/gm | GA/gm | GF/GA | W% | D% | L% |
| 2010/11 | 1.12 | 1.15 | 1.73 | 0.67 | 26.9% | 30.8% | 42.3% |
| 2009/10 Chron | 1.73 | 1.42 | 0.81 | 1.76 | 46.2% | 34.6% | 19.2% |
| 2009/10 Apples | 1.77 | 1.46 | 1.00 | 1.46 | 46.2% | 38.5% | 15.4% |
| Projections: | 42 | 44 | 66 |
We’re on pace for the perceived safety of 42 points, but that’s based on 38 games and remember the last two games are against Arsenal and Liverpool; we need to secure safety before then.
Graphs
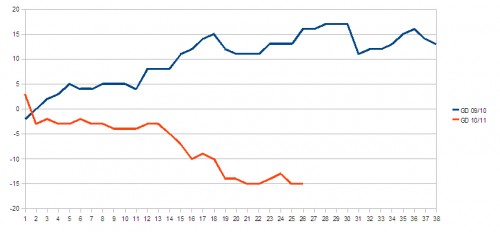
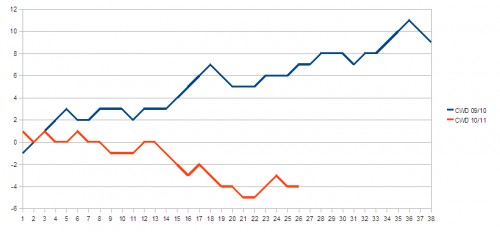
When it comes to the Cumulative Goal Difference and Cumulative Win Difference charts, we’ve basically bottomed out. Arresting the decline was important, but we really need to see the lines heading back toward the break even mark sooner rather than later though.
The next run of league games has to yield points:
- Blackpool (A)
- Blackburn (H)
- Bolton (A)
- Wolves (H)
Cumulative Goal Difference
Cumulative Win Difference
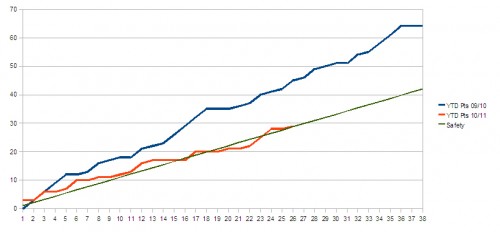
Cumulative Points
As the table above has already revealed, we’re bang on course for 42 points, but as I also said before; we can’t risk going into the last two games in need of points to secure survival. We must get back to winning ways.
So, ultimately, the positive vibe remains simply because of the players we have and the way that they’re playing. However, our position remains perilous, we could easily be in real trouble again with a couple of poor results.
Sticking with the one game at a time mantra, it’s Blackpool next. Not a team that should be taken for granted, especially at home, but we really, really need three points. Not easy for a team that used to be famous, but I think we can get it done.


