This Season vs Last Season #14
Written by Dan on October 31, 2011
We’re about to flip the calendar from October to November which means that we’ve already reached the 10 game mark of the season and it’s time for the latest instalment of This Season vs Last Season.
The eagled-eyed among you, and/or followers on Twitter, may have already seen the chronological numbers on the new Season Rankr page. I’ve been updating the table after each game, sorting the records for all 56 top flight seasons since World War II at the same stage.
After 10 games, then, 2011/12 ranks 39th out of 56. If it hadn’t been for Stéphane Sessègnon’s late equaliser on Saturday, and the score had finished 2-1, we would have had exactly the same record as David O’Leary had at this stage in 2004/05.
I know, we can only dream of such heady heights, right?
Here are those numbers again, but this time with the usual apples-to-apples comparison included.
| SEASON | Pld | W | D | L | GF | GA | Pts |
| 2011/12 | 10 | 2 | 6 | 2 | 13 | 13 | 12 |
| 2010/11 Chron | 10 | 3 | 3 | 4 | 9 | 13 | 12 |
| 2010/11 Apples | 10 | 3 | 4 | 3 | 12 | 13 | 13 |
Those two points dropped at the Stadium of Light were certainly costly, the table above would have looked a good deal healthier had we held out to win. Clichéd it may be, but those really are the points that come back to haunt you at the end of the season.
Points dropped from winning positions
Speaking of letting wins slip through our fingers, we were the league’s worst offender when it came to points dropped from winning positions last season; off the top of my head, I think it was 27 points squandered by the end of the season.
So far this season, we’ve remained entirely consistent and currently prop up the bottom of this particular table with nine points dropped from winning positions.
Hold on though; it’s obviously a frustrating statistic, but it’s easy to focus on the negative element. There were a few teams last year that held high positions in the table simply by rarely getting themselves a lead to throw away. Wigan spring to mind.
Right now, Bolton, Fulham, Sunderland, Wolves, Newcastle and Stoke all sit at the top of the table having not lost a single point from a winning position. That’s clearly far from impressive in several cases.
In order to drop points from a winning position, first you must obtain a winning position.
Degree of difficulty
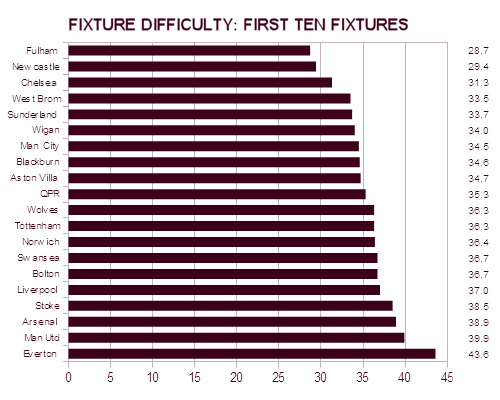
Back in August, shortly before the season kick off, I devised a system for assessing the relative degrees of difficulty in the fixture list for each team for the first six games. We knew the fixture calendar had been reasonably kind to Alex McLeish, but I wanted to know just how kind and how the other clubs had done.
It’s not a particularly sophisticated system, it’s largely based on finishing position in the league last season; something which becomes less relevant the further we travel into this season. Nevertheless, noting that eight of the sides we’ve faced so far currently occupy the bottom half of the table, I’ve pulled the relative difficulty rating numbers for the first 10 games:

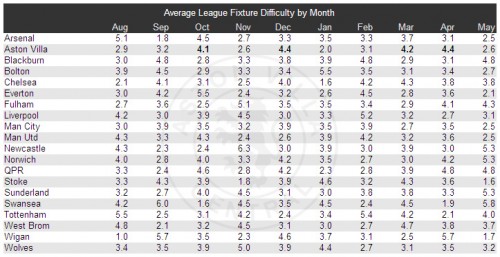
Again, the further we get from last season, the less relevant it becomes, but for what it’s worth, here are the average difficulty ratings by month for the whole season:
With yet another international break, we’re left with just three Premier League fixtures in November; Norwich, Tottenham and Swansea. According to the system, this appears to be one of the less challenging months then, but the reality is a bit different.
However, there’s absolutely no doubt about how tough December will be, we really do need to milk everything we can from the three games in November.
Projections
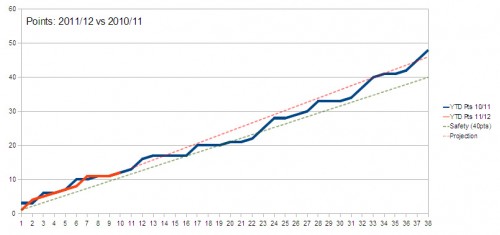
If we continue at the current rate, we’ll finish the season on 46 points which should secure an uninspiring, but safe position.
| SEASON | Pts/gm | GF/gm | GA/gm | GF/GA | W% | D% | L% |
| 2011/12 | 1.20 | 1.30 | 1.30 | 1.00 | 20.0% | 60.0% | 20.0% |
| 2010/11 Chron | 1.20 | 0.90 | 1.30 | 0.69 | 30.0% | 30.0% | 40.0% |
| 2010/11 Apples | 1.30 | 1.20 | 1.30 | 0.92 | 30.0% | 40.0% | 30.0% |
| 2010/11 Full Season | 1.26 | 1.26 | 1.55 | 0.81 | 31.6% | 31.6% | 36.8% |
| FULL SEASON | Pts | GF | GA | ||||
| PROJECTIONS | 46 | 49 | 49 |
In the graph below, the projections are shown, as they have to be, as straight lines. Chances are, we’ll dip below that green line of theoretical safety at some point before or around the turn of the year, as we did last year.
The question is, will nerves hold out this time?

