One Hundred And Forty Eight
Written by Dan on April 20, 2010
That’s how many Premiership games that Martin O’Neill has prowled the Aston Villa technical area “like a panther”. The significance? Oh, it’s the same number as John Gregory, which means that MON will effectively become our longest serving manager during the Premiership era when he takes charge of his 149th EPL game at Hull on Wednesday.
It seems a good time to update what is a loose series of posts analysing the current manager’s league performance in comparison with his predecessors. A quick recap of the posts at significant milestones:-
- Inspired by the American preoccupation of the first 100 days of any new administration, I looked at MON’s first 100 league games.
- That was followed by a two part article which explored 3 years of Martin O’Neill. The major significance of this post was that David O’Leary had enjoyed three years at the helm, so it was a good time to compare their 114 game records. Part one compares the accumulation of points during the first 114 games for the 4 managers who reached that number of games. Part two looks at their Win/Draw/Loss percentage and compares trends in points per game averages.
- A “Quickstat” post when MON reached the 189 points mark after 123 games; the same number of points that Brian Little achieved in his 130 game career in charge of Villa.
- A post which asked “Martin O’Neill – Great Manager or Greatest Manager” drew some responses questioning my definition of ‘great’. Interestingly, one or two people pointed out that MON and JG had similar records, but MON had spent a lot of money so that seemed to make JG’s record more impressive or, perhaps, MON’s less impressive.
- Most recently; I put that recent spend in context of the Premiership to date in response to MON’s record suddenly being judged against the top 4 in a period where they had cut back spending. The bottom line is that they had that luxury after many years of heavy investment, we did not.
In A Word
Back in December I did a quick analysis of our passing game and if there was one word that I was left with to describe the nature of our game, it would be ‘efficient‘. If there was one word I would use to describe the following analysis of MON’s record, it would be ‘momentum‘.
What we’ll see here today is that there are an awful lot of similarities between Martin O’Neill and John Gregory’s records over 148 league games, with MON edging most of the important statistics. However, the key difference is that Gregory started out brilliantly and faded towards the end of his Villa career and MON has almost done the opposite. When you consider the situations inherited by each manager, this shouldn’t be surprising, but the point is that at the 148 game mark, the greater momentum of growth and improvement lies with Martin O’Neill.
Some people like to ponder whether Martin O’Neill has taken Aston Villa as far as he can. I would say that he’s only just getting warmed up.
Alright, preamble over, let’s get all groovy and statistical! (By the way, this is a two page post, navigation at the foot).
Win, Lose or Draw
I could throw all the fancy graphs at you that I like, but what we’re all really interested in is winning games. Here’s the most important numbers:-
| Martin O’Neill | John Gregory | ||||
| Won | 59 | 39.86% | 61 | 41.22% | |
| Drawn | 53 | 35.81% | 46 | 31.08% | |
| Lost | 36 | 24.32% | 41 | 27.70% | |
| Points | 230 | 229 | |||
| Goals Scored | 216 | 195 | |||
| (Per Game) | 1.46 | 1.32 | |||
| Goals Conceded | 175 | 162 | |||
| (Per Game) | 1.18 | 1.09 | |||
| Goal Difference | 41 | 33 | |||
| GF / GA Ratio | 1.23 | 1.20 | |||
As you can see for yourself, over 148 games, Gregory managed two more wins than MON did over the same period. However, JG also lost 5 more games. The net result is that MON managed to get a single point more than Gregory. Pretty tight.
However, O’Neill’s Villa scored 21 more goals, but also conceded 13 more. The total number of goals per game under Gregory was 2.41, while under MON we’ve been treated to an average of 2.64 goals per game. That’s goals at both ends of course, I don’t know whether you wish to chalk that up as entertainment value or not, it’s up to you.
Graphs
I don’t want to go heavy on the numbers with this post and since the theme is demonstrating momentum, it’s easier done with graphs anyway. We’ll start with a current favourite of mine; Cumulative Win Difference.
Cumulative Win Difference
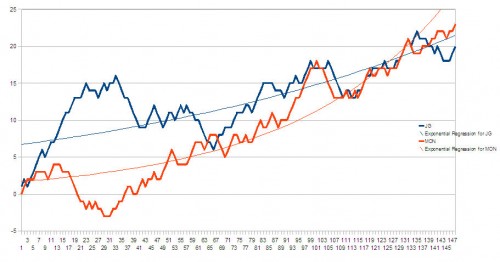
Gregory may have won a couple more games than O’Neill, but because he also lost more, MON has the edge when it comes to CWD. I like this graph because it’s a really nice, simple indicator of the basic fortunes of a club.
Here, you can clearly see that although MON got off to a reasonable start – 9 games unbeaten – it wasn’t long before the form returned to match that of O’Leary. Fortunately, MON turned things around towards the end of his first season. What was it people say about Aston Villa struggling at the end of the season?
By contrast, John Gregory’s fantastic start at the helm can’t be ignored. It was followed by a less than brilliant patch, but eventually sent back in the right direction, although it lacked the impressive early pace.
I’ve added exponential trend lines to show how MON has turned the early so-so form in to something that is going from strength to strength. At it’s worst point, JG had an a net win advantage over MON of 18, but after 148 games, MON has moved ahead by 3.
I think, if anything, this really highlights the lack of patience among the group who like to think that they’ll “give the manager one more season”. Really? And if he delivers another year of improvements, this trend continues, but you’re still not satisfied for whatever reason? Then what? Get someone else in and spend another 3 years rebuilding. No thanks.
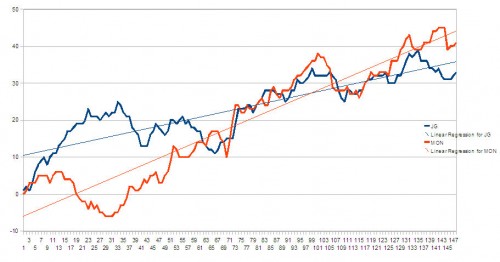
Cumulative Goal Difference
Like win difference, but because it can move up or down by more than one point, it can be a bit more dramatic. For instance, can you spot the recent 7-1 loss against Chelsea?
Once again, after a comparatively poor early period, MON has been playing catch up and now has a goal difference which is a net 8 goals better than John Gregory over the same period. Again, at it’s worst, JG had a net 30 goal lead over MON, but the momentum is now with the current manager.

