This Season vs Last Season #06
Written by Dan on March 17, 2010
I’ve really been looking forward to getting to this one. 28 games played, 10 left to go.
If you’ve been keeping a concerned eye on the fact that we’ve been running a little behind last year’s performance points wise lately then you may well have failed to realise that we were approaching the point where the wheels fell off the wagon last year. To be more precise; around this time last year we lost 4 on the bounce (games 28-31) and then drew 3 in a row (games 32-34). Yes, that’s just 3 points in 7 games!
You don’t use statistics like I do without knowing that was coming. I knew that if we were close to our performance at this point last year then we had the potential to kick on past that record in the next handful of games and in this post I’ll show you that is exactly where we are.
Even better, I’m also going to show you graphically how the last 28 games stack up against the same 28 fixtures last season, apples to apples, and you’ll see that we’re a country mile ahead of last season. In fact, if you’re not convinced by the end of this blog that the 2009/10 Aston Villa is a vast improvement over the 2008/09 Aston Villa then there’s nothing more I can do.
OK, let’s get on with it then.
![]()
The Tables
Usual fayre here, you know how to read this by now. Comparing our 28 games with the first 28 games from last season you can see that we’re 3 points worse off, have scored 3 less goals, but also conceded 7 less goals. But look at the apples to apples comparison. Yeah, that’s a but more like it, right?
| Season | Pld | W | D | L | GF | GA | Pts |
| 2009/10 | 28 | 13 | 10 | 5 | 39 | 22 | 49 |
| 2008/09 Chron | 28 | 15 | 7 | 6 | 42 | 29 | 52 |
| 2008/09 Apples | 28 | 11 | 9 | 8 | 40 | 36 | 42 |
It’s interesting that we bemoan the lack of goals, and that is a fair argument, we could definitely score more, but comparing this season against the same 28 games last season we’ve only scored one goal less. We conceded FOURTEEN less goals though! No wonder we’re 7 points better off by comparing apples to apples.
We’ve only lost 5 games this season, which is less than last year however you want to look at it.
28 games into this season is pretty close to 75%, or three quarters if you prefer fractions. That’s definitely far enough in to the season to take another comparative look at the current and previous seasons by introducing a few ratios. Check these bad boys out:-
| Season | Pts/gm | GF/gm | GA/gm | GF/GA | W% | D% | L% |
| 2009/10 | 1.75 | 1.39 | 0.79 | 1.77 | 46.4% | 35.7% | 17.9% |
| 2008/09 Chron | 1.86 | 1.50 | 1.04 | 1.45 | 53.6% | 25.0% | 21.4% |
| 2008/09 Apples | 1.50 | 1.43 | 1.29 | 1.11 | 39.3% | 32.1% | 28.6% |
Those numbers pretty much speak for themselves, so I’ll add very little narrative. The one statistic that I do just want to draw your attention to briefly is the Goals Scored per Goals Conceded ratio (GF/GA). So far this season we’ve scored 1.77 goals for every 1 goal we’ve conceded. It remains to be seen whether we can maintain that metric through to the end of the season, but it’s worth noting that our highest ratio at the end of any Premiership season was 1.49 in 1996 when we finished 4th.
In fact, proving that I have pre-Premiership records, you’d have to go back to Ron Saunder’s League winning team of 1981 to find the last superior GF/GA ratio at the end of the season. Oh, just in case you missed it, I said we won the title that year and the final GF/GA ratio was 1.80!
Still not convinced that we’re doing far better this time out? OK, you asked for it. It’s time for the graphs!
Let’s Get Graphical
There’s four charts coming up. The first two will show you this current season against last season chronologically and last season’s dramatic decline could not be clearer. The second charts are the same as the first two except I’ve replotted the 2008/09 season data using the same apples to apples data from the tables above. The improvement this season over last season is undeniable.
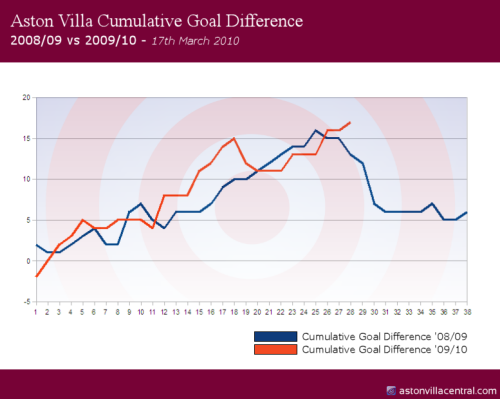
Cumulative Goal Difference – 2008/09 vs 2009/10 – Chronological Comparison
First up, I want to return to that graphing metric I discovered on Wikipedia – Cumulative Goal Difference. It’s such a simple, yet brilliant representation of our fortunes during the course of a season. If you haven’t seen this before, it couldn’t be easier; I’m simply plotting our GD after every game and over the course of the season you get a much better feel of how things are going than plotting things like league position, which is influenced by other games around us, or points which can only go up, not down (unless you’re Portsmouth).
You can see a nasty dip in the red line representing this season from games 19 & 20 – the 3-0 loss at the Emirates and Liverpool’s fortunate 1-0 victory at Villa Park – however, we managed to recover and the current GD is 17, compared with a GD of 13 after 28 games last season.
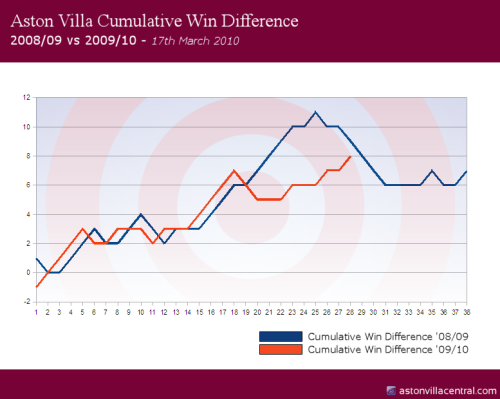
Cumulative Win Difference – 2008/09 vs 2009/10 – Chronological Comparison
As far as I know, this is a metric of my own invention. I’ve certainly never seen it used anywhere else and I’m claiming it as mine. The principle is exactly the same as the Cumulative Goal Difference chart above, except the rise and fall of the line can never exceed +/- 1 per game (no change represents a draw). It’s more subtle than the chart above where a 5-0 loss, like against Liverpool at Anfield, while a traumatic loss, is still just a loss in this chart. So it’s basically the same information, just less hysterical.
You’ll see the chart corresponds nicely with the point I alluded to already; the loss of form last season was really quite terrible and this season, the red line is beautifully poised to pop above last season’s blue line with just a handful of the coming games going in our favour.
You may also have noticed that our net win figure at the end of last season was 7 and we’re currently sat on 8, so as long as we win at least as many as we lose over the final 10 games, there will be an improvement over last season. However, don’t dwell on that as it’s the weakest of weak points in this post.
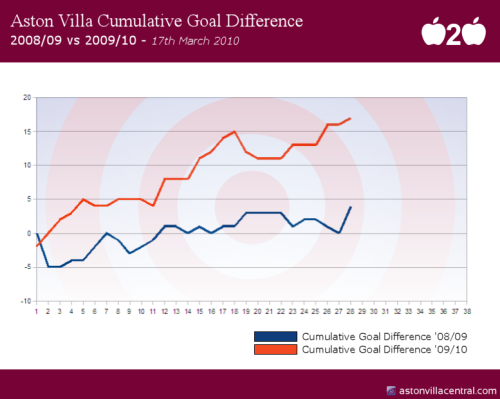
Cumulative Goal Difference – 2008/09 vs 2009/10 – Apples to Apples Comparison
I’ve added a little logo to the chart below to differentiate it from the one above. Yes, that’s the Apple computer logo with the bite restored. Don’t judge me.
As I’ve already said, I’ve replotted the 2008/09 season using the apples to apples data summarised in the tables at the top. I haven’t shown data for the final 10 games from the 2008/09 season as we’re still to hear confirmation of a couple of re-scheduled games and as this is a history remix of sorts, it’s not that important.
What is important is the comparison of 28 games from this season like-for-like with 28 from last season and this chart speaks for itself, so I’ll shut up.
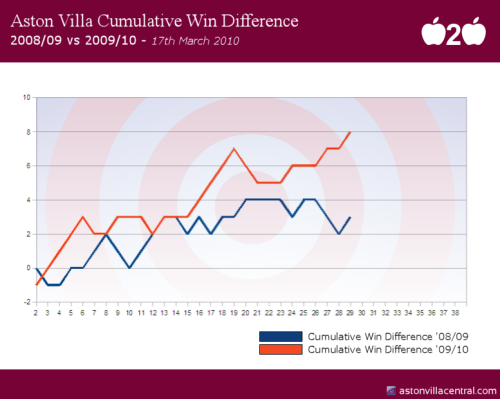
Cumulative Win Difference – 2008/09 vs 2009/10 – Apples to Apples Comparison
Same again, this time Win Difference plotted as a like-for-like comparison with the previous season and, once again, it speaks for itself.
Any questions?
It’s Getting Better, Man
It really is. Season on season, we’re going from strength to strength in every little corner of our fine football club. Of course, there’s 10 games still to be played and it’s as likely that we could lose all 10 as win them all (actually, that is unlikely to be true, but let’s not get into the realms of actual probability as that’s really boring), but I’ve a strong feeling that we’ll end up better off at the end of this season than the previous one.
Whether that will be enough to finish in a position that pays a Champions League place remains to be seen, but it’s not out of the question. Ultimately, league position is defined by the teams around you as much, if not more, than by your own performance. All we can control are our own fortunes, how the other teams do in their 36 games where they’re not playing us is out of our hands.
The real question for me will be how people will feel if we don’t make the top 4 this season. Will that make the season a failure? I don’t think so, but there will be some unrest still I’m sure.
I’ll close off by recycling a couple of charts I’ve used here recently which illustrate the bigger picture. On top, we have the points won from the other 6 members of the Premiership Seven (which obviously doesn’t include games yet to be played against Chelsea and Everton this season) and on the bottom it’s the Cumulative Win Difference & Goal Difference chart covering the entire Premiership history up until the beginning of this year. Obviously the purpose of that chart is to illustrate the turn around in fortunate in the last few seasons.
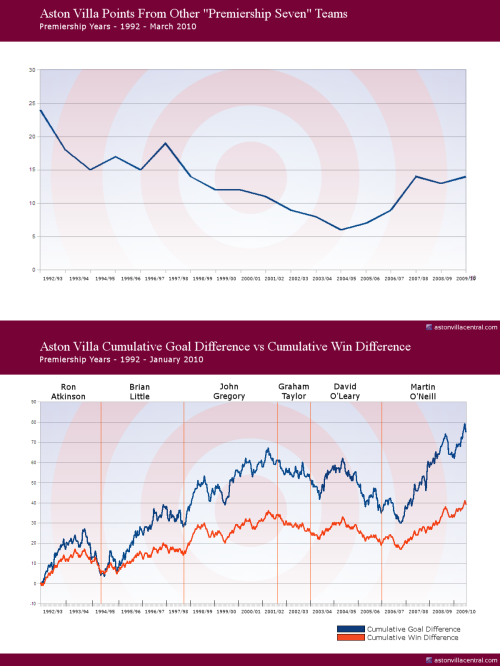
The big picture for me is that the last 3 seasons, and this one so far, have been seasons of growth over the past. As long as that continues, and I have to accept that there may be a dip here and there, I can not possibly be unhappy.
How about you?