This Season vs Last Season #07
Written by Dan on April 16, 2010
This is the final part of the series comparing this season against last season both chronologically and using and apples to apples comparison. In case you missed it, I chose at the beginning to map the following 3 promoted teams to 3 relegated teams:-
- Birmingham City = West Brom
- Burnley = Middlesbrough
- Wolves = Newcastle
I’m going to use the same tables and graphs from Part 6, but I just wanted to add some “big picture” perspective before we go on. We’ve played 33 games this season and now have 55 points. Sidestepping the ’87/88 season because we were in the old Second Division, ’09/10 at this stage is the 6th best season in the last 32 years at the same point. I have adjusted the older seasons to 3 points for a win of course. It may well be the 6th best season over a longer period for all I know, I currently only have 32 years’ of records on file, I’m not cherry picking the period to make it look better than it really is.
If you’re interested; we had 70 points at this stage of ’80/81, 62 points in ’89/90, 61 points in ’92/93, 59 points in ’95/96 and 56 points in ’96/97. The Guardian’s Scott Murray has written an interesting blog casting some suspicion on the quality of the title won in ’80/81. I’m not saying I agree with him, it’s really before my time in all honesty, but it’s definitely worth reading.

The Tables
We’re still ahead on points using both methods, but the substantial number of draws this year are beginning to stand out. Hopefully that balance will be addressed over the final 5 games. Once again, we could also do with scoring a few goals, but that’s generally a prerequisite of winning games anyway.
| Season | Pld | W | D | L | GF | GA | Pts |
| 2009/10 | 33 | 14 | 13 | 6 | 46 | 34 | 55 |
| 2008/09 Chron | 33 | 15 | 9 | 9 | 49 | 43 | 54 |
| 2008/09 Apples | 33 | 13 | 11 | 9 | 47 | 43 | 50 |
Last time, I took time to point out that despite our slightly disappointing goal scoring rate, when expressed as a ratio in comparison to the goals conceded it was a reasonably impressive 1.77. The 7-1 hammering put a big dent in that and, although it’s still better than last year however you look at it, it’s now down to 1.35 goals scored for every goal conceded.
| Season | Pts/gm | GF/gm | GA/gm | GF/GA | W% | D% | L% |
| 2009/10 | 1.67 | 1.39 | 1.03 | 1.35 | 42.4% | 39.4% | 18.2% |
| 2008/09 Chron | 1.64 | 1.48 | 1.30 | 1.14 | 45.5% | 27.3% | 27.3% |
| 2008/09 Apples | 1.52 | 1.42 | 1.30 | 1.09 | 39.4% | 33.3% | 27.3% |
The points per game ratio has fallen from 1.75 in part 6 (28 games) to 1.67 now after 33 games played. We’ll maintain that rate by taking at least 9 points from the final 5 games. That will see us finish on 64 points and a points per game ratio which will be the best since the very first Premiership season in 1992/93 – 1.76 pts/game.
But we’d like to see more than 9 points, wouldn’t we?
Graphs
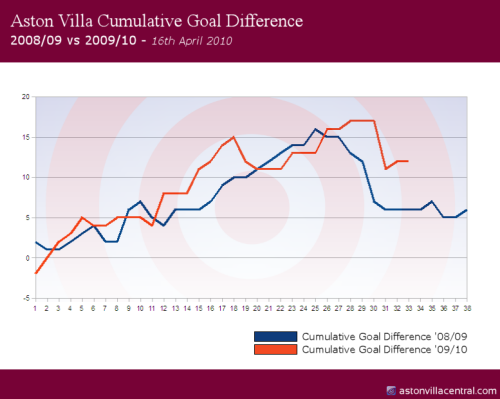
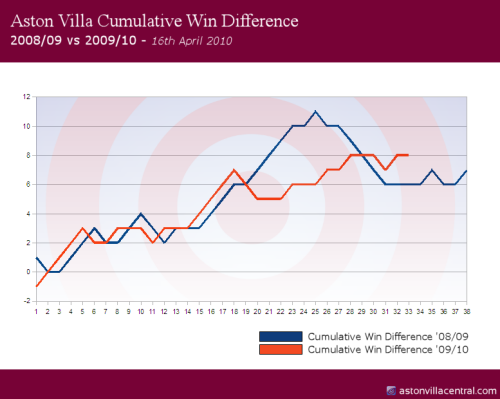
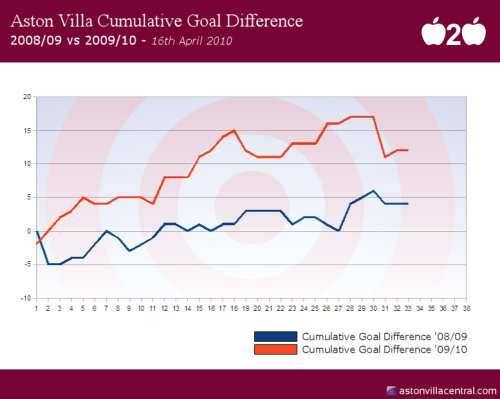
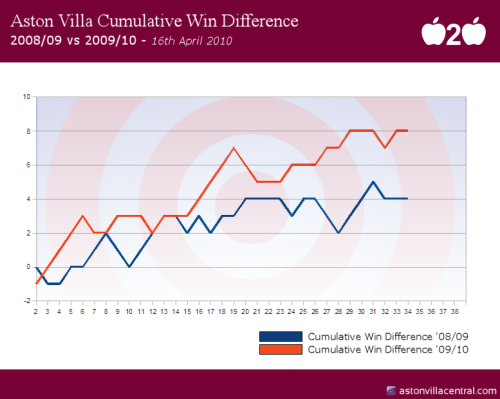
Again, same format as part 6. I’m going to chart two data sequences; Cumulative Goal Difference and Cumulative Win Difference, for the two methods of comparison; Chronological and Apples to Apples.
I’m going to add zero narrative this time, the graphs speak for themselves. Once again, this season is better than last season, but it’s not without potential for it all to go horribly wrong. We clearly have to get some wins under out belt and the next two fixtures against Portsmouth and Hull, albeit them both being away, could not be more welcome.
Cumulative Goal Difference – 2008/09 vs 2009/10 – Chronological Comparison

Cumulative Win Difference – 2008/09 vs 2009/10 – Chronological Comparison

Cumulative Goal Difference – 2008/09 vs 2009/10 – Apples to Apples Comparison

Cumulative Win Difference – 2008/09 vs 2009/10 – Apples to Apples Comparison

Five To Go
So here we are. Five games to go, 15 points left on the table.
7 points from these 5 games will match last season’s total.
8 points from these 5 games will beat last season’s total.
9 points from these 5 games will be our best Premiership season finish since the very first season in 1992/93.
What position this will place us in remains to be seen, but there is everything still to play for. If somehow we did manage to win all 5 games and take 15 points, it’s worth remembering that 70 points would have achieved at least 4th in 11 out of 17 seasons, although, crucially, not in the last two seasons.